
1. The Sunflower That Started It All
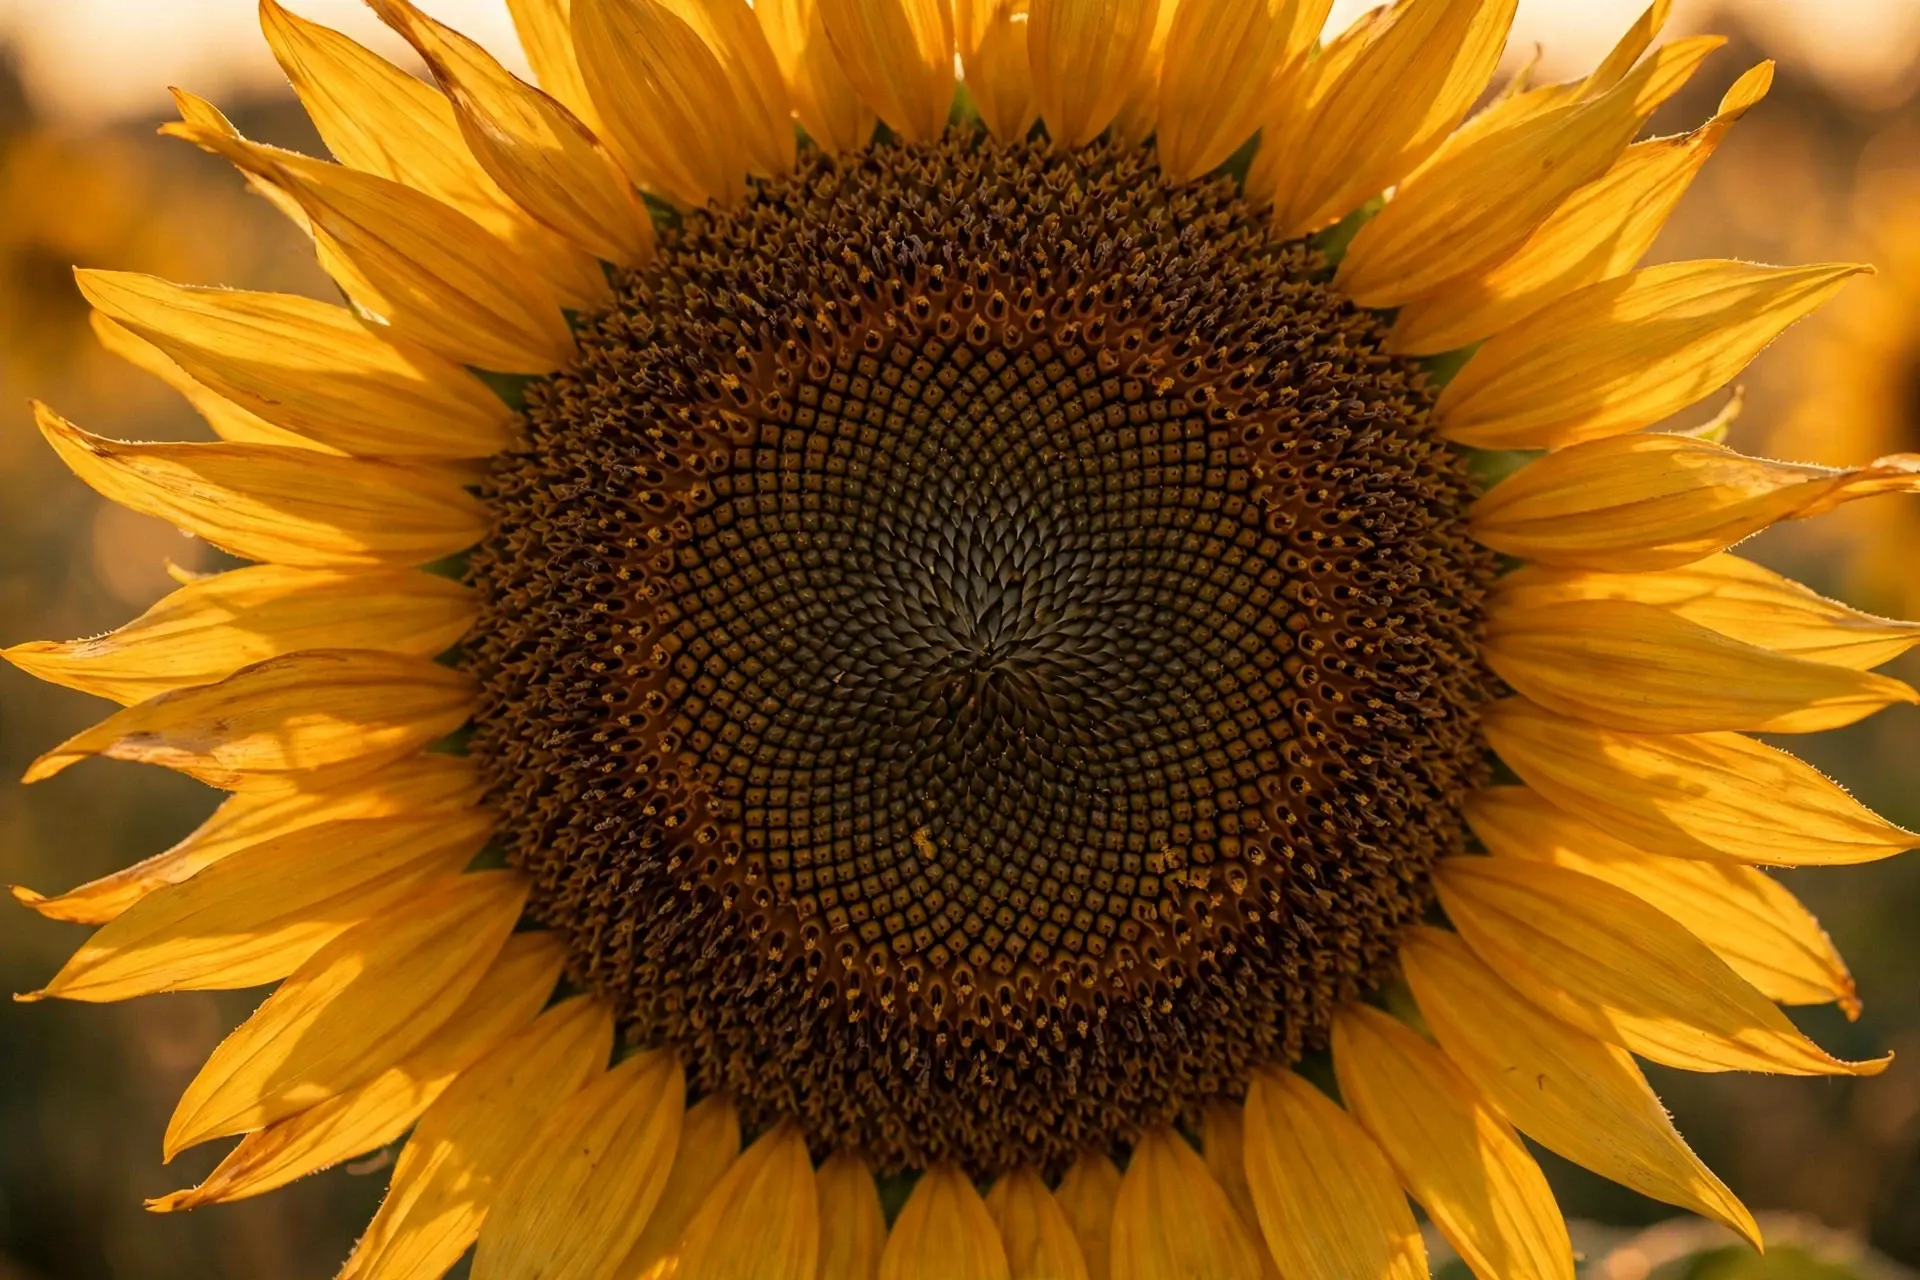
I was standing in a friend's garden with a sunflower in my hand and a phone in the other, counting spirals the way you count sheep — slowly, and twice, because the first count did not believe itself. Clockwise, I found 34. Anticlockwise, 55. Two numbers, side by side, from the most famous counting game in mathematics. This article is about the golden ratio and Fibonacci sequence — what they are, how they are connected, and how much of what you have heard about them is actually true.
The two numbers I counted, 34 and 55, are neighbours in a sequence that starts 1, 1, 2, 3, 5, 8, 13, 21, 34, 55, 89… — each number the sum of the two before it. It is called the Fibonacci sequence, after the Italian mathematician who introduced it to Europe in 1202. And the ratio of 55 to 34 is 1.6176, a whisper away from 1.618034 — the golden ratio, a number the ancient Greeks called the extreme and mean ratio and the Renaissance called the divine proportion.
That is the claim, anyway. You have probably seen the posters: a sunflower head with a golden spiral drawn over it, a nautilus shell captioned "nature's perfect spiral", the Parthenon with a golden rectangle fitted around its columns, the Mona Lisa with a rectangle around her face. The story is seductive. It says that one number, 1.618, runs like a secret thread through flowers and shells and temples and paintings — that nature and art both obey the same hidden law.
Some of that story is true. Some of it is not. And the line between the two is more interesting than either side alone, because the true parts are true for a reason you can understand, and the false parts are false for a reason you can check.
The sunflower in my hand was real. When scientists asked hundreds of volunteers to grow sunflowers and count their spirals, most heads really did show Fibonacci numbers — but about one head in five showed no Fibonacci pattern at all, and nobody had checked that properly until 2016. The nautilus shell is not real: when someone finally measured eighty of them, the ratio came out at 1.31, not 1.618, and the shell grows three times bigger per turn where a golden spiral would grow nearly seven times. The Parthenon is not real either: measured honestly, its proportions come out at 2.25 or 1.72, depending on where you put the ruler, and nobody wrote down a golden rectangle until two thousand years after the builders were dead.
So this is not an article that will tell you the golden ratio is everywhere. It is an article that will show you where it really is, why it is there, and how to tell the difference — with every number worked out in front of you, so you never have to take my word for it.
We will start with the ratio itself: what it is, where the number 1.618 comes from, and why it has the strangest property in all of arithmetic. Then we will meet the rabbit puzzle that created the Fibonacci sequence, and watch the two ideas walk towards each other until they meet. Then we will go outside — to sunflowers and pinecones, where the pattern is genuinely there — and then to the myths, the nautilus and the Parthenon and the Mona Lisa, where it is not. Along the way we will visit the artists who really did use the ratio on purpose, the computer scientists who use Fibonacci numbers to sort and search, and the traders who draw Fibonacci lines on their charts and swear by them. And we will end with the question that started all of this: is the golden ratio beautiful? The answer, it turns out, is more complicated — and more honest — than the posters suggest.
One promise before we begin. Every number in this article can be checked with a pocket calculator. Every claim about a measurement names the person who made it and the year they made it. And wherever the story splits — wherever the popular version and the measured version disagree — I will show you both, and let the numbers decide.
2. What Is the Golden Ratio?
Take a line and cut it into two pieces — a longer piece and a shorter piece. Now ask a question: is there a cut where the whole line relates to the longer piece exactly as the longer piece relates to the shorter piece? In other words, can you cut a line so that the ratio of the whole to the big part equals the ratio of the big part to the small part?
There is exactly one cut that does it. Call the longer piece a and the shorter piece b. The condition is (a + b) / a = a / b. Call that shared ratio φ, the Greek letter phi. Then a / b = φ, and (a + b) / a = 1 + b / a = 1 + 1 / φ. So the condition becomes φ = 1 + 1 / φ. Multiply through by φ and you get φ² = φ + 1. This is a quadratic equation, φ² − φ − 1 = 0, and its positive root is φ = (1 + √5) / 2.
That is the whole definition, and it is worth pausing on, because everything else in this article follows from it. The golden ratio is not a number someone chose because it looked nice. It is the number that solves a particular, simple geometric puzzle: cut a line so that the parts relate to each other the way the whole relates to the largest part. There is one answer, and it is irrational.
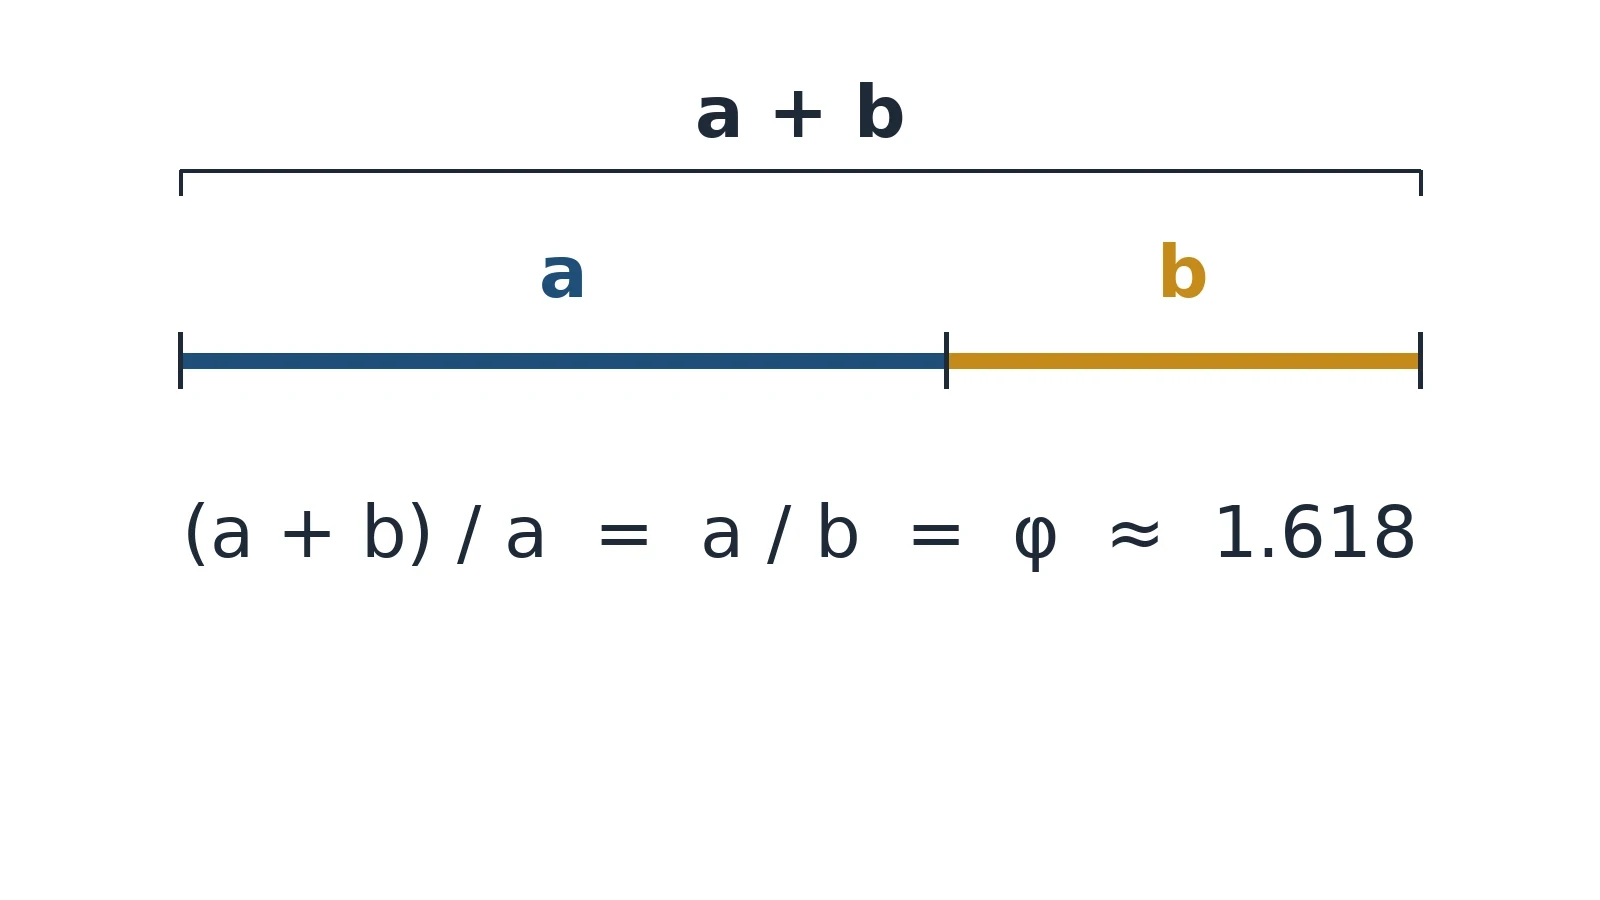
The value is φ ≈ 1.618033988749895. It goes on forever without repeating, because φ is irrational — it cannot be written as a ratio of two whole numbers. The square root of five is irrational, and adding one and halving it does not fix that. So 1.618 is an approximation, and 1.618034 is a better one, and no finite decimal will ever be exact. That matters, because it means every measurement that claims to "find" the golden ratio in a building or a shell is really finding a number close to 1.618 — and "close" needs a definition, which is where most of the myths in this story quietly cheat.
The equation φ² = φ + 1 gives the golden ratio two habits that no other number has in quite the same combination. First, squaring φ is the same as adding one: φ² ≈ 2.618034. Second, taking the reciprocal of φ is the same as subtracting one: 1 / φ = φ − 1 ≈ 0.618034. The digits after the decimal point are the same in all three numbers — 1.618034, 2.618034, 0.618034 — which is the kind of coincidence that makes mathematicians smile and numerologists overreach. It is a genuine property, and it falls straight out of the definition. It is also why the numbers 61.8 percent, 38.2 percent and 23.6 percent keep turning up later in this article, in a trading chart: 1 / φ ≈ 0.618, 1 / φ² ≈ 0.382, 1 / φ³ ≈ 0.236.
There is one more property, and it is the deepest of the three. Write φ as a continued fraction — a fraction built out of whole numbers stacked inside each other, like a set of Russian dolls. Most numbers have continued fractions that mix large and small numbers. The golden ratio's is all ones:
φ = 1 + 1 / (1 + 1 / (1 + 1 / (1 + …)))
On and on, ones forever. That makes φ the slowest-converging continued fraction of any number, which is a technical way of saying it is the hardest number in the world to approximate with a simple fraction. Mathematicians sometimes call it the "most irrational" number. That sounds like a joke, but it is a precise statement with a real consequence — and it is the reason sunflowers pack their seeds the way they do, as we will see in section 6. For now, file it away: of all the numbers you could pick, φ is the one furthest from any simple fraction.
The Greeks knew this number, though not by the name we use. Euclid, writing his Elements around 300 BCE, defined it in Book VI, Definition 3, as the "extreme and mean ratio": a straight line is cut in extreme and mean ratio when the whole line is to the greater segment as the greater segment is to the lesser. Euclid proved things about it and used it to construct the regular pentagon, but he did not treat it as mystical, and he did not claim it governed nature. The name "golden section" was popularised by the German mathematician Martin Ohm in 1835 — the earliest known printed use is Johann Samuel Traugott Gehler's dictionary of 1789 — and the Greek letter φ was proposed for the ratio only in the early twentieth century, by the American mathematician Mark Barr, who chose it after Phidias, the Greek sculptor whose work adorned the Parthenon. That choice of letter has caused no end of confusion, because it makes it sound as if Phidias used the ratio, which is precisely the claim we will test in section 10. He did not, as far as anyone can show.
So the golden ratio is a real number with real properties, defined by a simple geometric condition, known since antiquity and named only recently. It is 1.618034, irrational, self-similar under squaring and reciprocation, and harder to approximate with fractions than any other number. Keep that in your pocket. Now meet the sequence that keeps bumping into it.
3. The Fibonacci Sequence: A Puzzle About Rabbits
In 1202, a young Italian mathematician named Leonardo of Pisa published a book called Liber Abaci — the Book of Calculation. Leonardo is better known by his nickname, Fibonacci, which means "son of Bonacci". His book is famous for introducing Europe to the Hindu-Arabic numerals we still use today, the digits 0 through 9 that replaced Roman numerals. But tucked inside it is a puzzle about rabbits, and the puzzle contains a sequence of numbers that would outlive everything else in the book.
The puzzle goes like this. Suppose you start with one pair of newborn rabbits. Rabbits take one month to mature. Once mature, each pair produces one new pair every month, and no rabbit ever dies. How many pairs will you have after a year?
Work it out month by month. In month one you have one pair, newborn. In month two it has matured, but it has not yet produced young, so you still have one pair. In month three it produces its first new pair, so you have two pairs: the parents and the newborns. In month four the parents produce another pair, but the month-three pair is still maturing, so you have three pairs. In month five the parents produce a pair and the month-three pair produces its first pair, so you have five pairs. The pattern is already visible. Each month's total is the sum of the two months before it — because the pairs alive last month are all still alive, and the pairs alive the month before that are exactly the ones old enough to have produced a new pair this month.
| Month | Newborn pairs | Mature pairs | Total pairs |
|---|---|---|---|
| 1 | 1 | 0 | 1 |
| 2 | 0 | 1 | 1 |
| 3 | 1 | 1 | 2 |
| 4 | 1 | 2 | 3 |
| 5 | 2 | 3 | 5 |
| 6 | 3 | 5 | 8 |
| 7 | 5 | 8 | 13 |
| 8 | 8 | 13 | 21 |
| 9 | 13 | 21 | 34 |
| 10 | 21 | 34 | 55 |
| 11 | 34 | 55 | 89 |
| 12 | 55 | 89 | 144 |
After twelve months you have 144 pairs of rabbits. The sequence in the last column — 1, 1, 2, 3, 5, 8, 13, 21, 34, 55, 89, 144 — is the Fibonacci sequence. The rule is the simplest imaginable: each term is the sum of the two before it. Written as a formula, F(n) = F(n−1) + F(n−2), starting with F(1) = 1 and F(2) = 1. And the sequence does not stop at twelve months. It goes on: 233, 377, 610, 987, 1597, 2584, 4181, 6765, and on forever, growing by roughly sixty-two percent at every step once it gets going.
The first time I worked through the rabbit puzzle myself, I made the same mistake most people make: I tried to count the rabbits directly, month by month, tracking newborns and parents separately, and I lost the thread by month six. The trick is the one in the table — stop counting rabbits and start counting relationships. The number of pairs this month is the number last month plus the number the month before, because every pair alive two months ago is now a parent. Once you see that, the whole sequence falls out of a single sentence. It is the first lesson of this article, and it will come back in the sunflower: complicated patterns often come from very simple rules, repeated.
The rabbit puzzle is a toy, of course. Real rabbits die, and real rabbit populations do not grow by sixty-two percent a month forever. Fibonacci knew that; the puzzle was a teaching device, a way to show off the new arithmetic. But the sequence itself turned out to be anything but a toy. It appears in the family trees of bees, in the branching of trees, in the arrangement of leaves on a stem — and, as we will see, in the seeds of a sunflower. It also has a habit of turning up inside pure mathematics, in places nobody invited it.
One of those places is the sum rule. Add up the first ten Fibonacci numbers — 1 + 1 + 2 + 3 + 5 + 8 + 13 + 21 + 34 + 55 — and you get 143. Now look at the twelfth Fibonacci number, 144, and subtract one. You get 143 again. That is not a coincidence. The sum of the first n Fibonacci numbers is always F(n+2) − 1. It is a small, clean fact, and you can prove it in a minute by writing out the additions and watching them telescope. It is also a useful check: if you ever add a column of Fibonacci numbers by hand and the total does not match F(n+2) − 1, you have made an arithmetic error somewhere.
A deeper fact hides inside the sequence. There is a formula that gives you the nth Fibonacci number directly, without adding up all the ones before it. It is called Binet's formula, published by the French mathematician Jacques Binet in 1843 — though Abraham de Moivre and Daniel Bernoulli had both known it more than a century earlier. It says:
F(n) = (φⁿ − ψⁿ) / √5
where φ is our golden ratio, 1.618034, and ψ is its less famous sibling, (1 − √5) / 2, which is about −0.618034. The formula looks impossible: it involves irrational numbers and a square root, yet it always produces a whole number. The trick is that ψ is smaller than one in size, so ψⁿ shrinks towards zero as n grows, and the irrational parts cancel exactly. What is left is the nearest whole number to φⁿ / √5. Check it for n = 20: φ²⁰ / √5 is 6765.00003, and the twentieth Fibonacci number is 6765. For n = 10 it gives 55, and for n = 15 it gives 610 — all exact.
Pause on what that means. The Fibonacci sequence is defined by addition — add the last two, repeat. And yet its closed form, the formula that jumps straight to any term, is built out of the golden ratio. The sequence and the ratio are not two separate ideas that happen to look alike. They are the same idea seen from two sides. The next section shows the meeting itself, with the numbers on the table.
4. How the Golden Ratio and Fibonacci Sequence Meet
Divide each Fibonacci number by the one before it, and watch what happens.
| Ratio | Value | Distance from φ |
|---|---|---|
| 2 / 1 | 2.000000 | +0.381966 |
| 3 / 2 | 1.500000 | −0.118034 |
| 5 / 3 | 1.666667 | +0.048633 |
| 8 / 5 | 1.600000 | −0.018034 |
| 13 / 8 | 1.625000 | +0.006966 |
| 21 / 13 | 1.615385 | −0.002649 |
| 34 / 21 | 1.619048 | +0.001014 |
| 55 / 34 | 1.617647 | −0.000387 |
| 89 / 55 | 1.618182 | +0.000148 |
| 144 / 89 | 1.617978 | −0.000056 |
| 233 / 144 | 1.618056 | +0.000022 |
| 377 / 233 | 1.618026 | −0.000008 |
| 610 / 377 | 1.618037 | +0.000003 |
The ratios close in on φ, 1.618034, alternating above and below it — overshoot, undershoot, overshoot, undershoot — with the error shrinking by a factor of about 2.6 at every step. By the thirteenth ratio the gap is three millionths. By the twentieth term the gap is less than one ten-millionth. The Fibonacci sequence, built from nothing but addition, converges on the golden ratio, built from nothing but a cut line. That is the meeting point, and it is one of the most satisfying sights in elementary mathematics.
Johannes Kepler noticed it in the early 1600s — he rediscovered the connection in 1608, and wrote about it in his 1611 essay On the Six-Cornered Snowflake, the same essay in which he wondered why snowflakes have six sides. The German mathematician Simon Jacob had noted the convergence earlier, in 1560; Kepler found it again, independently. Kepler saw that the ratios of successive Fibonacci numbers approached the golden ratio, and he was enchanted. He called the golden ratio one of the two great treasures of geometry, the other being Pythagoras' theorem.
"Geometry has two great treasures: one is the Theorem of Pythagoras; the other, the division of a line into extreme and mean ratio. The first we may compare to a measure of gold; the second we may name a precious jewel." — Johannes Kepler, in a 1597 letter to Michael Maestlin, as quoted in Mario Livio's The Golden Ratio (2002)
He was not being mystical; he was recognising that two ideas which looked unrelated were secretly the same idea.
Why does it happen? The reason fits in one line of algebra. Suppose the ratio of consecutive Fibonacci numbers settles down to some limit, call it q. Then the rule F(n+1) = F(n) + F(n−1) becomes, after dividing both sides by F(n): q = 1 + 1/q. Multiply through by q and you get q² = q + 1 — the very equation that defines φ. So if the ratio settles anywhere, it must settle at φ. And it does settle, because the error shrinks at every step: each new ratio is closer to φ than the last, and the alternation above and below means the sequence is squeezed from both sides.
This is also where the golden ratio touches the subject of our previous article. Convergence — the idea that a sequence of numbers can approach a limit without ever reaching it — is one of the central ideas of calculus, and the Fibonacci ratios are one of the cleanest examples of it anywhere in mathematics. The ratios never equal φ, because φ is irrational and every ratio is a fraction of whole numbers. They approach it forever, getting closer with every step, and the gap between the ratio and φ is itself governed by the Fibonacci numbers: the error after n steps is roughly 1 / (√5 × F(n)²), which is why it shrinks so fast. If you want the full story of limits and convergence, our article on how calculus works takes it up from there; here, the point is simpler. Two definitions — a cut line and a rabbit puzzle — lead to the same number, and the bridge between them is one line of algebra.
There is a second bridge, and it is worth a sentence, because it explains why the Fibonacci numbers keep turning up in nature. The ratio q = 1 + 1/q is not just an equation; it is a recipe for the best possible approximations to φ. Every Fibonacci ratio is the best approximation to φ you can get with a fraction of that size — no other fraction with a denominator that small gets closer. That is the continued fraction at work again, the one made entirely of ones. And it is the reason the sunflower, which needs to place its seeds as evenly as possible, ends up using Fibonacci numbers. The plant is not doing arithmetic. It is doing geometry, and the geometry keeps producing the same numbers.
Before we go outside, take stock of what we have. The golden ratio is the number 1.618034, defined by a cut line. The Fibonacci sequence is 1, 1, 2, 3, 5, 8, 13, 21, 34, 55, 89, 144, and so on, defined by adding the last two. The ratios of consecutive Fibonacci numbers converge to the golden ratio, and the convergence is fast, alternating, and exact in the limit. That is the whole mathematical core of this article — everything from here on is about where these numbers show up in the world, and where they do not.
5. The Golden Rectangle and the Golden Spiral
The golden ratio has a shape, and the shape is a rectangle. Take a rectangle whose long side is φ times its short side — say 1.618 units by 1 unit. That is a golden rectangle. Now cut a square off one end of it. The piece that is left is another rectangle, and its sides are in the ratio 1 to 0.618 — which is the same ratio, φ to 1, because 1 / 0.618 is 1.618. Cut a square off that rectangle, and the piece left behind is a golden rectangle again, smaller still. You can keep going forever, each time producing a smaller golden rectangle, each time with the same proportions.
That self-similarity is the rectangle's whole character. Most rectangles, when you cut a square off them, leave behind a rectangle of a different shape. The golden rectangle is the only one that leaves behind a copy of itself. It is the geometric version of the equation φ² = φ + 1: take away one square and the ratio is unchanged.
Now draw the spiral. In each square you cut off, draw a quarter-circle arc from one corner to the next, and join the arcs together. The curve that results is an approximation to the golden spiral — a spiral built out of Fibonacci squares. Start with two squares of side 1, then a square of side 2, then 3, then 5, then 8, then 13, and the spiral winds outwards, growing by a factor of φ every quarter turn. The picture is beautiful, and it is the image most people have in mind when they think of the golden ratio: a spiral of squares, each one the sum of the two before it, curling outwards in perfect proportion.
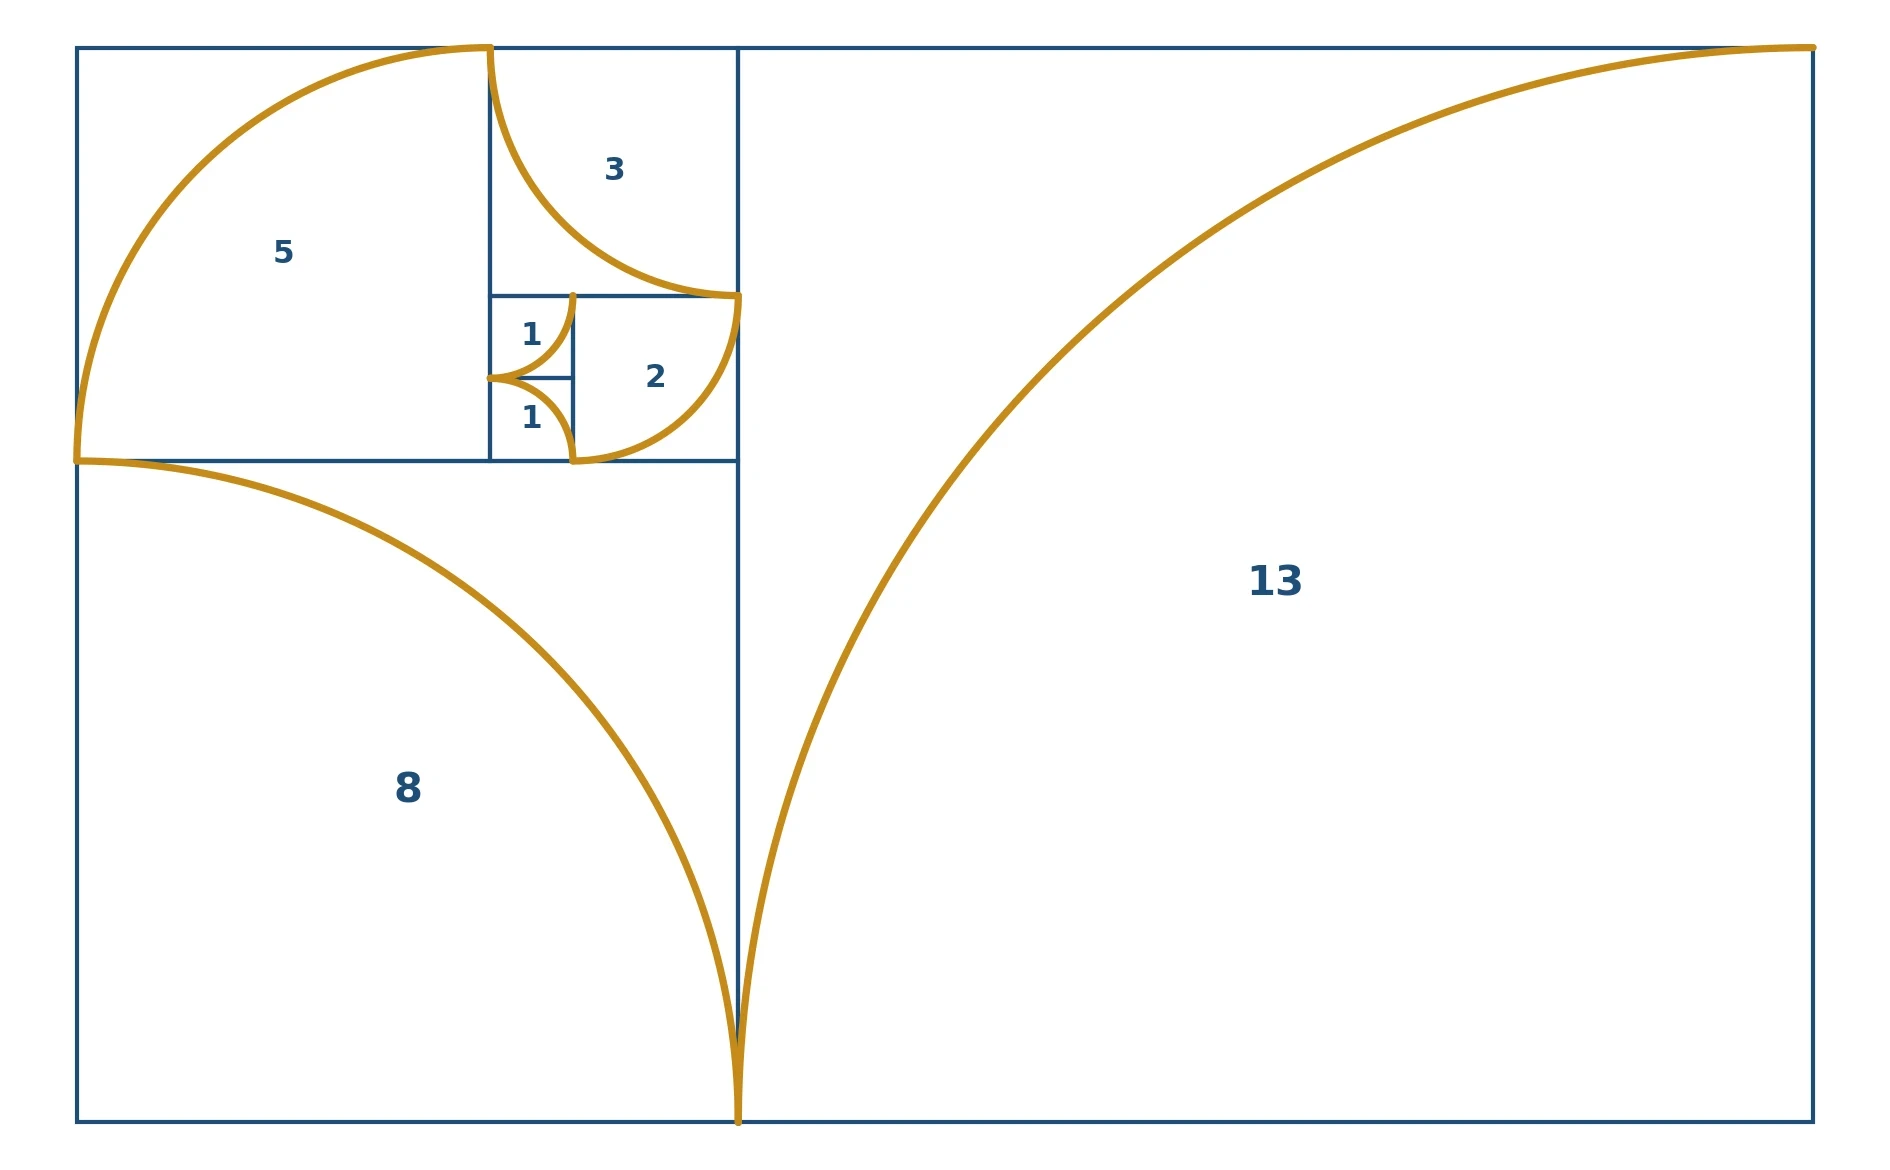
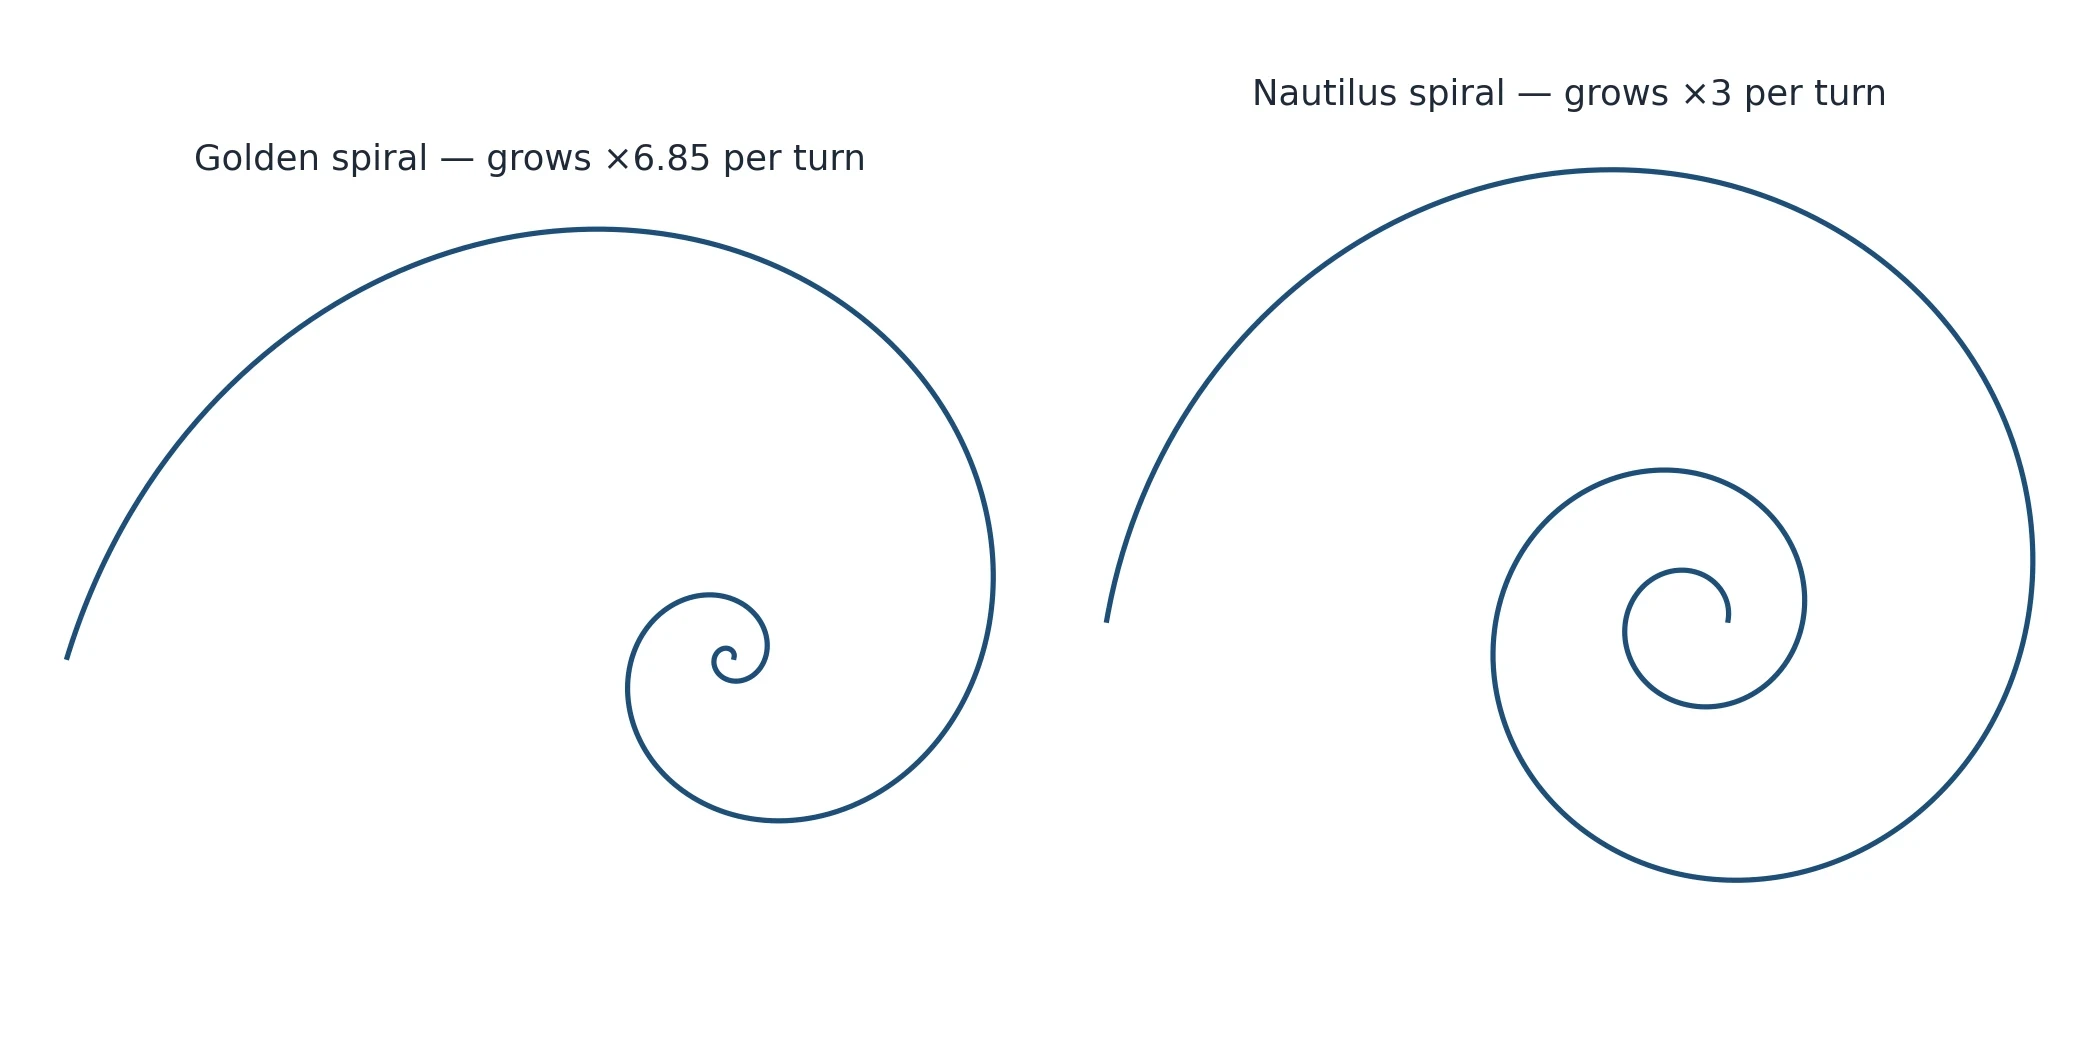
It is important to be precise about what this spiral is and what it is not. The golden spiral is one member of a much larger family called logarithmic spirals, or equiangular spirals: curves that grow by the same factor every time they turn through the same angle, so that the shape looks the same at every scale. A golden spiral grows by φ, about 1.618, per quarter turn, which means it grows by φ⁴, about 6.85, in one full turn. But a logarithmic spiral can grow by any factor at all — two per turn, three per turn, ten per turn — and it will still be a logarithmic spiral, still self-similar, still beautiful. The golden spiral is the one with the golden growth factor. Most spirals in nature are logarithmic. Very few are golden. That distinction is the key to the whole second half of this article, and it is the distinction the posters usually forget.
The golden rectangle and the golden spiral also lead to a shape with a surprising property: the regular pentagon. In a regular pentagon — five equal sides, five equal angles — the ratio of a diagonal to a side is exactly φ. Draw all five diagonals and you get a five-pointed star, a pentagram, and the pentagram is full of golden triangles: triangles whose sides are in the ratio φ to 1. Euclid knew this; it is why the golden ratio appears in his construction of the pentagon in Book IV of the Elements, two books before he even defines the ratio in Book VI. The pentagon is the most direct route from the golden ratio to a shape you can draw with a compass and a straightedge, and it is the reason φ turns up in the geometry of flowers with five petals — a connection we will meet in section 7.
There is one more spiral worth mentioning, because it will matter when we look at the sky. Spiral galaxies and hurricanes both form spiral shapes, and both are sometimes described as golden spirals in popular writing. They are not. A spiral galaxy's arms are shaped by the rotation of stars and gas around the galactic centre, and a hurricane's spiral is shaped by the rotation of the Earth and the flow of moist air — and neither follows a golden spiral's growth factor. What they share with the golden spiral is the logarithmic family: they grow outward by a roughly constant factor per turn, which is what makes them look like spirals at all. Our articles on galaxies and hurricanes take up the real physics of those shapes; here, the point is the warning. A spiral is not automatically golden, any more than a rectangle is automatically golden. The word "golden" means one specific number, 1.618, and the test is always the same: measure it.
With the shapes in hand — the rectangle, the spiral, the pentagon — we can now go outside and look at the real thing. The next two sections are about the places where the golden ratio genuinely appears in nature, and the reason is not magic. It is geometry, and it starts with an angle.
6. The Golden Angle and the Sunflower
Look closely at a sunflower head and you will see two families of spirals crossing each other — one family winding clockwise, the other anticlockwise. Count the spirals in each family, and you will usually get two consecutive Fibonacci numbers: 34 one way and 55 the other, or 55 and 89 in a big head. This is the most famous fact in the whole subject, and unlike the nautilus and the Parthenon, it is true. But it is true for a reason that has nothing to do with beauty, and everything to do with packing.
A sunflower head is a factory for seeds, and the factory has a problem. It must place hundreds of seeds on a flat disc so that every seed gets roughly the same amount of room — no gaps, no crowding — because a gap is wasted space and a crowded seed is a stunted seed. The plant solves the problem one seed at a time. In Vogel's model, each new seed appears at the centre of the head, at a fixed angle from the previous seed, and older seeds are pushed outwards as new ones arrive. That is the model's bookkeeping, not quite the plant's process: in a real sunflower head, new florets form first at the outer rim and the pattern fills inwards towards the centre. But the geometry is the same either way — what matters is the angle between one part and the next, not the direction the pattern travels. The only decision the plant has to make is the angle.
Imagine choosing badly. If each new seed appears 120 degrees after the last one — a third of a turn — then every third seed lands on the same spoke, and you get three straight arms with empty wedges between them. If you choose 90 degrees, you get four arms. If you choose 144 degrees, which is two fifths of a turn, you get five arms. Any angle that is a simple fraction of a full turn lines the seeds up on a few spokes and leaves gaps. The plant needs an angle that is not a simple fraction of a turn — an angle whose fraction of a turn is hard to approximate with simple fractions, so the seeds never line up.
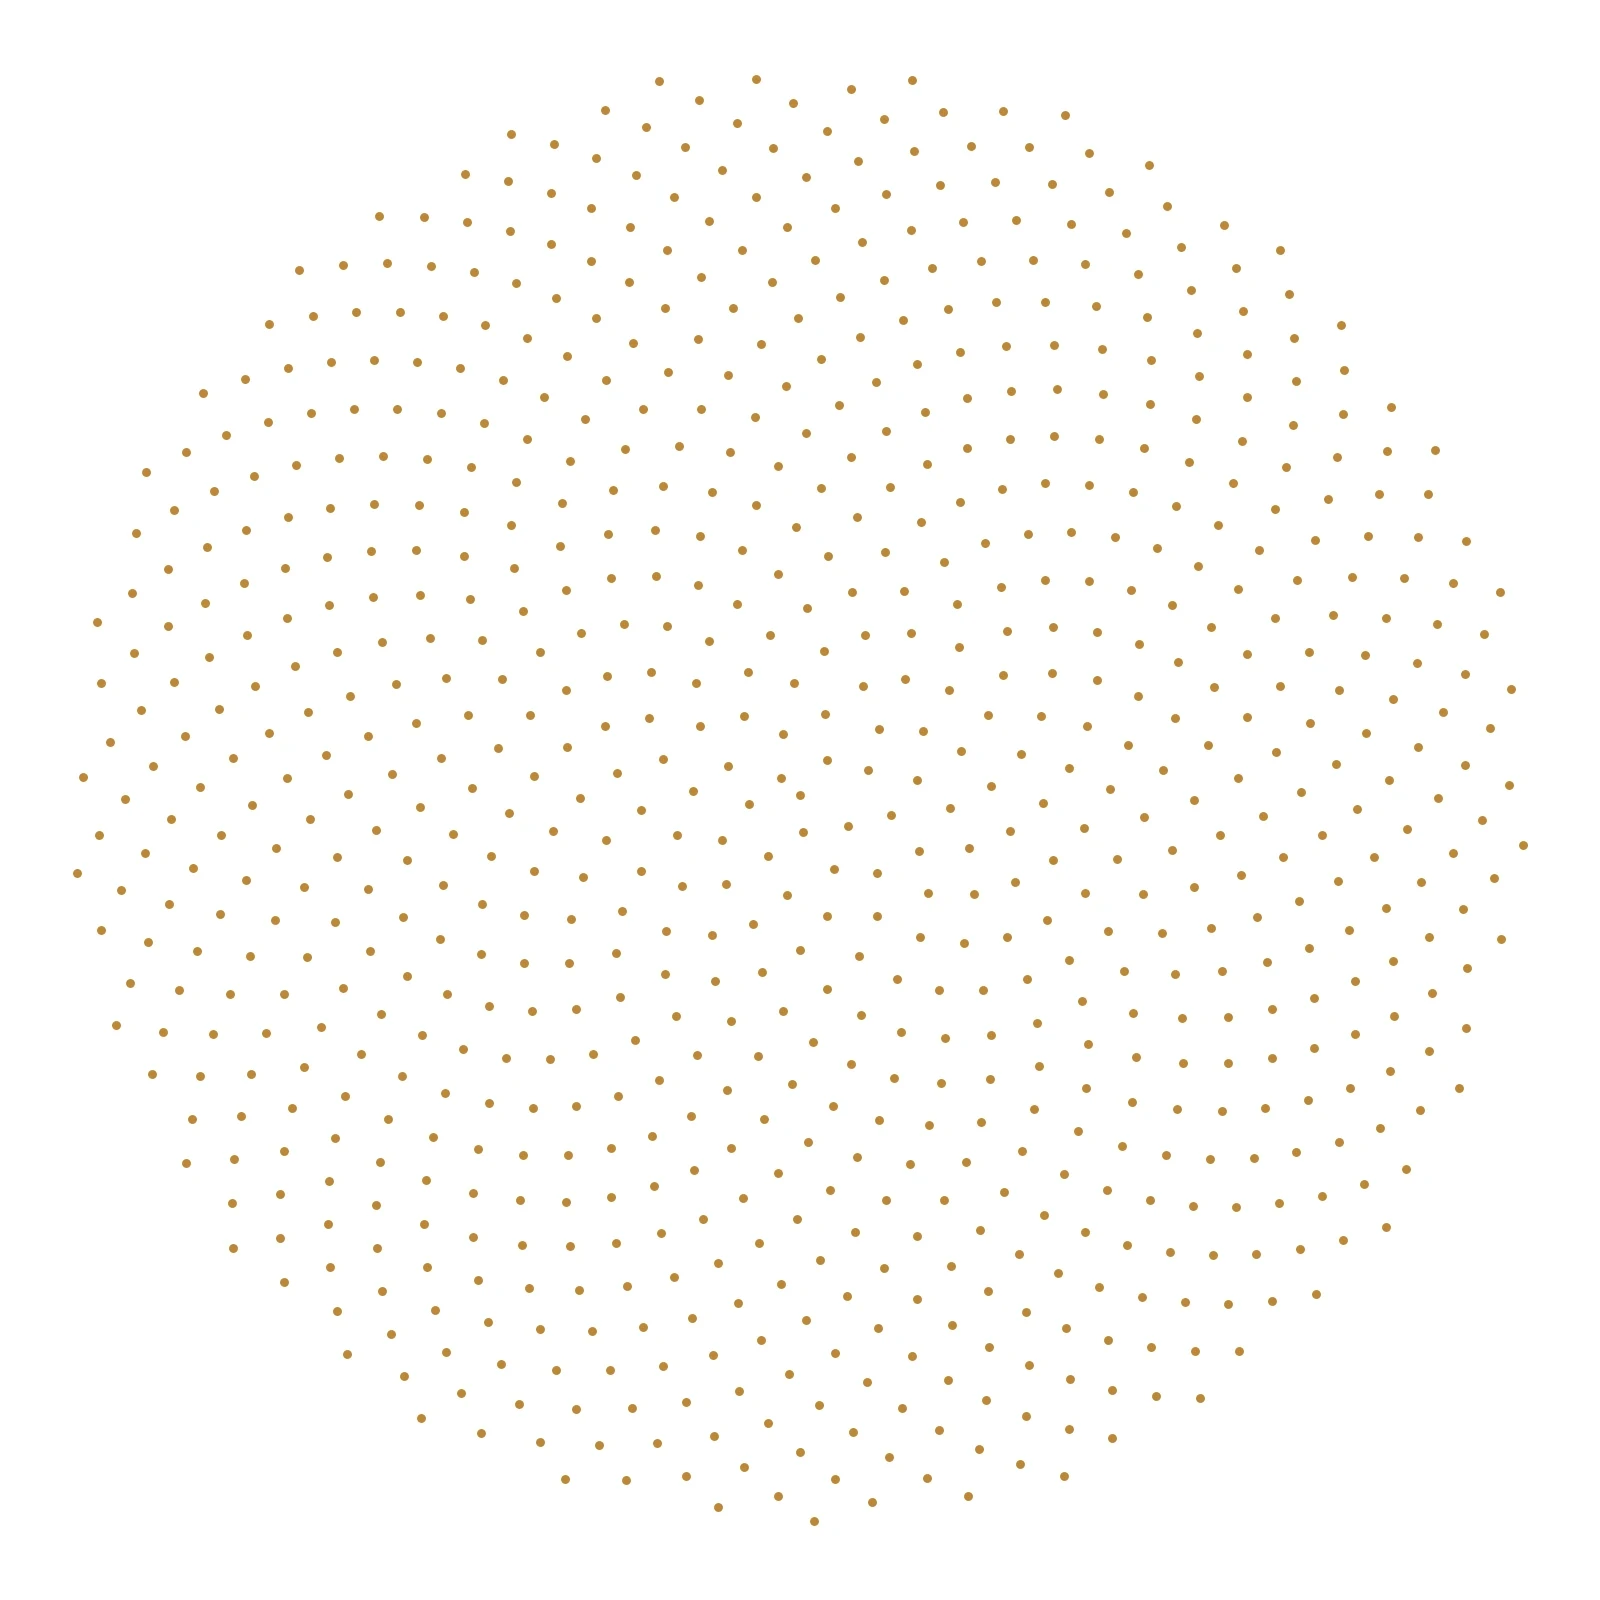
The hardest fraction of a turn to approximate with simple fractions is the one that comes from the golden ratio: 1/φ², about 0.381966. It inherits that property from φ, whose continued fraction is all ones. And the angle that corresponds to it is 360 degrees times 0.381966, which is about 137.5077 degrees. That is the golden angle. Each new seed appears 137.5 degrees after the last one, and the result is a disc packed so evenly that no spoke and no gap ever forms. The spirals your eye picks out — the 34 and the 55 — are not drawn by the plant. They are what your visual system sees when it connects each seed to its nearest neighbours in a pattern laid down at 137.5 degrees. Change the angle by even one degree, and the pattern visibly degrades. At a rational angle like 120° or 144°, it falls apart into spokes altogether.
This is not a metaphor. In 1979, the German botanist Helmut Vogel wrote down the exact model: seed number n sits at an angle of n times 137.5 degrees, and at a distance from the centre proportional to the square root of n. The square root keeps every seed's local area roughly constant as the head grows, and the golden angle keeps the arrangement even. Plot eight hundred points by that rule and you get a sunflower head, spiral families and all, without ever mentioning a Fibonacci number. The Fibonacci numbers appear as a consequence — the numbers of spirals your eye counts are always consecutive Fibonacci numbers, because those are the best approximations to the golden angle's fraction. You can see the model at work in an interactive simulation of phyllotaxis and the golden angle, which lets you change the angle and watch the pattern collapse into spokes.
A clear explanation of the same model, with pictures of what goes wrong at other angles, is given by That's Maths, which shows the sunflower as a problem in efficiency rather than a piece of decoration. And the efficiency point is worth underlining, because it is the answer to the question the sunflower always raises: did the plant "choose" the golden angle? No. The plant does not know the golden ratio, and it does not need to. New parts form where there is room, guided by the plant hormone auxin, and the arrangement that emerges when each new part takes the largest available gap is the golden angle. The mathematics describes the outcome of a local growth rule, not a blueprint the plant follows. Evolution selected the outcome, because a head that packs its seeds evenly makes more seeds. The number 1.618 is in the sunflower the way the number pi is in a soap bubble: not because anyone put it there, but because it is the number that solves the geometry problem.
The same growth rule explains why the golden angle turns up far beyond sunflowers. Wherever a plant adds new parts one at a time around a growing tip — the leaves on a stem, the scales on a pinecone, the florets in a daisy — the same packing problem appears, and the same angle solves it. That is why the Fibonacci numbers are the commonest numbers in botany. Our article on plant evolution takes up how plants arrived at these growth rules over hundreds of millions of years; here, the point is that the pattern is real, it is measurable, and it has a mechanism. The sunflower earned its place on the posters. What it did not earn is the company it keeps there — which is the subject of the next three sections.
7. Petals, Pinecones, and Pineapples
The sunflower is not alone. Once you know what to count, Fibonacci numbers turn up all over the plant kingdom — in petals, in pinecones, in pineapples, in the branching of trees. And the reason is always the same growth rule, working in different shapes.
Start with petals. Count the petals on a lily and you will usually find three. A buttercup has five. A delphinium has eight. A marigold has thirteen. An aster has twenty-one. A daisy has thirty-four, fifty-five, or eighty-nine. Those are the Fibonacci numbers, in order, and they are not a coincidence. A flower's petals form around a growing tip, and the counts that turn up are the same Fibonacci numbers — though petals form in whorls, several at once, rather than one at a time like sunflower seeds, so the packing story is looser here than in the sunflower head. The counts are tendencies, not laws: individual flowers vary, and a daisy with thirty-three petals is not a crisis. But the pattern across species is real, and it is the same mechanism as the sunflower's.
Pinecones tell the same story in a different shape. Look at the scales on a pinecone and you will see spirals running in both directions, just as on a sunflower head. Count them, and a typical pinecone shows eight spirals one way and thirteen the other. Pineapples are richer still: their scales show three families of spirals at once — eight, thirteen, and twenty-one — running in three directions across the surface. The same rule, the same numbers, wrapped around a different shape.
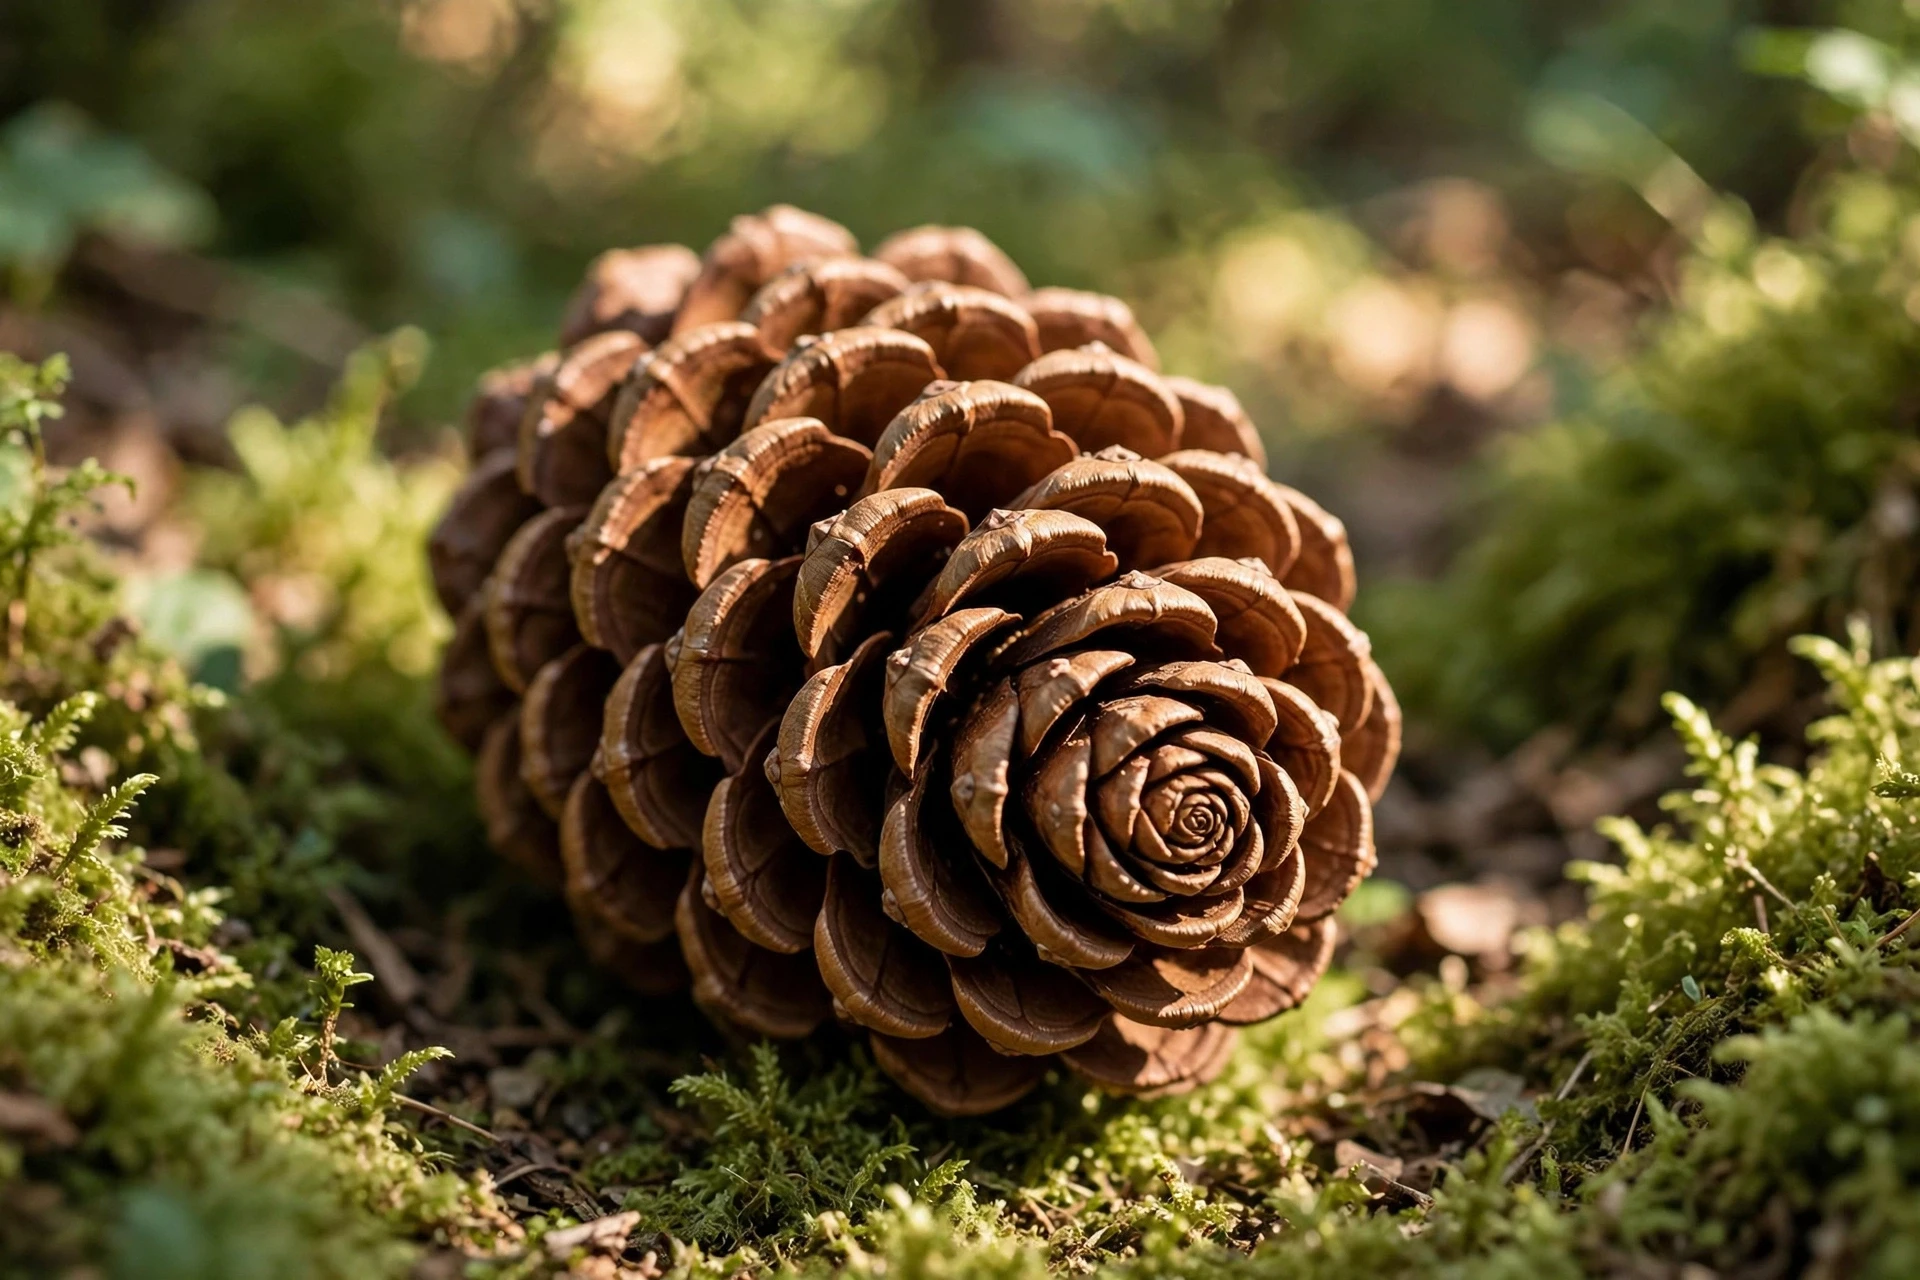
The mechanism is worth a second look, because it corrects the most common misunderstanding in this whole subject. People sometimes imagine the plant "using" the golden ratio the way an architect uses a ruler — deliberately, with a plan. That is backwards. What the plant does is purely local: each new part forms in the biggest available gap, guided by the plant hormone auxin. There is no global plan, no measurement, no target angle. The golden angle emerges from the local rule, the way a honeycomb's hexagons emerge from bees packing wax as tightly as possible, or the way a soap bubble's sphere emerges from surface tension minimising area. The plant kingdom is full of Fibonacci numbers for the same reason the physical world is full of circles: because the geometry of packing and minimising waste keeps producing the same numbers.
That also explains why the pattern is not universal. Not every plant grows by adding parts one at a time around a tip, and not every flower has Fibonacci petals. Some plants add parts in pairs, or in whorls of three or four at once, and their numbers follow different rules. A plant that adds leaves in opposite pairs will show powers of two, not Fibonacci numbers. The golden ratio is the answer to one particular growth problem — one part at a time, evenly packed — and where the problem is different, the answer is different. That is exactly what you would expect from a mechanism, and exactly what you would not expect from a mystical law of nature. A law that was everywhere would be suspicious. A mechanism that appears wherever its conditions hold is science.
There is a related point about the carbon in all of this. Every one of these structures — the sunflower head, the pinecone, the petal — is built by photosynthesis, the process that turns sunlight and carbon dioxide into plant tissue. The packing problem is a problem of building living material efficiently, and the material is carbon. Our article on the carbon cycle follows that carbon from the air into the plant and back again; here, the point is that the golden ratio in nature is not a decoration on top of biology. It is a consequence of biology's most basic economy: make the most structure from the least material, with the least waste.
So the real evidence is strong. Sunflowers, pinecones, pineapples, petals — the Fibonacci numbers are genuinely there, and the reason they are there is understood. But the same cannot be said for the other two famous examples, the nautilus and the Parthenon. Those are the myths, and they are worth taking apart carefully, because the way they fail teaches you how to check the next claim you meet.
8. The 2016 Sunflower Census: When Nature Breaks Its Own Rule
If the sunflower story ended with section 6, it would be a tidy story: the golden angle packs seeds best, so sunflowers use it, and their spirals come in Fibonacci numbers. But science is not tidy, and the most interesting thing about the sunflower is what happened when someone finally counted properly — at scale, with hundreds of flowers, and published the results whether they were flattering or not.
The project began with Alan Turing. In the early 1950s, Turing — the mathematician who had broken the Enigma code and founded computer science — turned to the mathematics of how living things grow. He speculated that the Fibonacci pattern in sunflowers might come from a simple chemical mechanism, a reaction-diffusion process, and he wrote about it in his 1952 paper on the chemical basis of morphogenesis. He died in 1954, before he could test the idea.
Sixty years later, the Museum of Science and Industry in Manchester decided to test it for him. For the centenary of Turing's birth in 2012, the museum launched a citizen-science project: volunteers across Britain would grow sunflowers, photograph their heads, and submit the pictures, and researchers would count the spirals. The project ran for several years, and the results were published in 2016 by Jonathan Swinton, Erinma Ochu and the MSI Turing's Sunflower Consortium, in the journal Royal Society Open Science.
The scale of the count is what makes it worth reading. The researchers verified 657 sunflowers, and in the most reliable subset they made 768 clockwise and anticlockwise spiral counts. Of those, 565 were Fibonacci numbers — 73.6 percent. A further 67 counts had Fibonacci structure of a predefined type: 41 were Lucas numbers, a close cousin of the Fibonacci sequence we will meet in section 14, and 25 were doubled Fibonacci numbers. Add those in and 632 of 768 counts, 82.3 percent, had some Fibonacci structure. And 136 counts — 17.7 percent, nearly one in five — had no Fibonacci structure at all.
Read that again, because it is the most honest number in this article. Nearly one sunflower in five breaks the rule. The counts one below a Fibonacci number were significantly more common than the counts one above — 49 cases against 17 — and some heads were quasi-regular, with no spiral number assignable at all. The study was the first to systematically report seed heads with no Fibonacci structure, and its authors were careful about what that meant. They did not conclude that the golden ratio is a myth. They concluded that the pattern is real but not universal — that the growth mechanism usually produces Fibonacci spirals, and sometimes produces something else, and that the exceptions are part of the story, not an embarrassment to be hidden.
That is how science is supposed to work, and it is the opposite of how the posters work. A poster shows you one perfect sunflower and implies that every sunflower is like it. A census shows you 657 sunflowers and tells you that four in five are like it and one in five is not. The census is less flattering and more true, and it is more interesting, because the exceptions are where the mechanism shows its seams. Why would counts one below a Fibonacci number turn up 49 times, and counts one above it only 17 times? Why would some heads have no assignable number at all? Those are live questions, and they are the questions a real theory has to answer. A myth has no questions. A measurement has nothing but questions.
The census also matters because of who did it. It was not a team of professional botanists in a greenhouse. It was hundreds of volunteers in back gardens, growing sunflowers from seed, photographing them, and sending the pictures in. The project was citizen science in the full sense: ordinary people doing the counting, and researchers doing the analysis. You can read the paper yourself — the full text is freely available through the Royal Society Open Science archive — and the numbers above are taken from it. When you read a claim about the golden ratio in nature, that is the standard to hold it to: how many were counted, by whom, and what fraction did not fit?
Keep that standard in mind. It is about to fail, twice, in the next two sections.
9. The Nautilus: The Myth That Will Not Go Away
If the sunflower is the true story, the chambered nautilus is the false one — and it is false in a way that has survived every attempt to correct it, which makes it the most instructive myth in this article.
The claim is everywhere. Open a book on sacred geometry, a poster on mathematical beauty, or a chapter on the golden ratio, and you will find the nautilus shell: a creamy, chambered spiral, captioned as nature's perfect golden spiral, proof that the golden ratio governs the sea as surely as it governs the sunflower. The shell is beautiful. The spiral is real. The claim is wrong.
A nautilus shell is a logarithmic spiral. That much is true, and it is genuinely remarkable: as the animal grows, it adds a new chamber to its shell, each one larger than the last, and the shell keeps the same shape at every scale. That is the defining property of a logarithmic spiral — self-similar growth — and the nautilus does it beautifully. But a logarithmic spiral is a family, not a single curve. The family is defined by one number: how much bigger the spiral gets per turn. A golden spiral grows by a factor of φ⁴, about 6.85, per full turn, because it grows by φ, 1.618, per quarter turn. The nautilus grows by a factor of about three per full turn. That is not a rounding error. That is a different spiral.
The measurement that settled it was made by Christopher Bartlett, an art professor at Towson University, who measured eighty nautilus shells in the collection of the Smithsonian National Museum of Natural History. He measured the length-to-height ratio of each shell — the number that should be 1.618 if the shell were golden — and the average came out at about 1.31. That is a difference of nineteen percent, far outside the five-to-ten-percent tolerance that experimental work usually accepts. A shell at 1.31 is not a golden spiral that missed. It is a different spiral altogether. Bartlett published the result in 2019 in the Nexus Network Journal, and his conclusion was blunt: the nautilus is not a golden spiral, and the popular claim is a myth.
He was not the first to say so. In 2005, the mathematician Clement Falbo measured nautilus shells and concluded that the ratio was "somewhere around 4 to 3… not phi". In 2002, John Sharp measured the growth factor per turn at between 2.83 and 3.02, averaging about 2.94 — again, about three, not 6.85. Per quarter turn, the nautilus grows by about 1.30 to 1.32, not 1.618. Three independent measurements, over seventeen years, all saying the same thing: the nautilus is a logarithmic spiral with a growth factor of about three, and the golden spiral, with its growth factor of 6.85, is a different curve.
So how did the myth survive its own refutation? Partly because of a cartoon. In 1959, Disney released Donald in Mathemagic Land, an educational film in which Donald Duck tours the world of mathematics, and one of its most memorable sequences presents the nautilus shell as a textbook golden spiral. Millions of children saw it, and the image stuck. Partly because of a bestselling novel: Dan Brown's The Da Vinci Code, published in 2003, tells its readers that the nautilus shell is a golden spiral, and the book sold tens of millions of copies. And partly because of an irony that the mathematician Keith Devlin has written about with admirable honesty. In a 2007 column called "The Myth That Will Not Go Away", Devlin admitted that while he was debunking other golden-ratio claims, he had himself repeated the nautilus claim without checking it — and that the myth had survived because even the people correcting it had not corrected that part.
A good account of the whole affair, with the measurements laid out plainly, is given by Science Friday, which walks through Bartlett's eighty shells and explains why the shell's ratio is 1.31 and not 1.618. Our article on the deep sea takes up the nautilus itself — where it lives, how it moves, why its shell is chambered — and the animal is remarkable enough without the golden ratio. It belongs to a lineage stretching back hundreds of millions of years. It does not need a myth to be interesting.
The nautilus teaches the lesson that the sunflower census taught in the other direction. The sunflower is true because someone counted hundreds of flowers and published the fraction that did not fit. The nautilus is false because, for decades, nobody counted at all — they copied a picture from a book, which had copied it from a film, which had drawn it from an idea. When Bartlett finally counted eighty shells, the answer was 1.31, and it had been 1.31 all along. The shell had not changed. The counting had.
There is a coda worth adding, because it is generous to the myth. The nautilus is still a logarithmic spiral, and logarithmic spirals are still remarkable — self-similar growth, the same shape at every scale, the geometry of adding chambers without changing the plan. The error was only in calling it golden. A spiral can be logarithmic without being golden, just as a rectangle can be a rectangle without being golden. The myth's mistake was not in admiring the shell. It was in admiring it for the wrong number.
10. The Parthenon and the Mona Lisa: Measuring the Legends
The nautilus is a myth about nature. The Parthenon is a myth about art — and it fails in the same way, for the same reason: nobody measured it before drawing the rectangle.
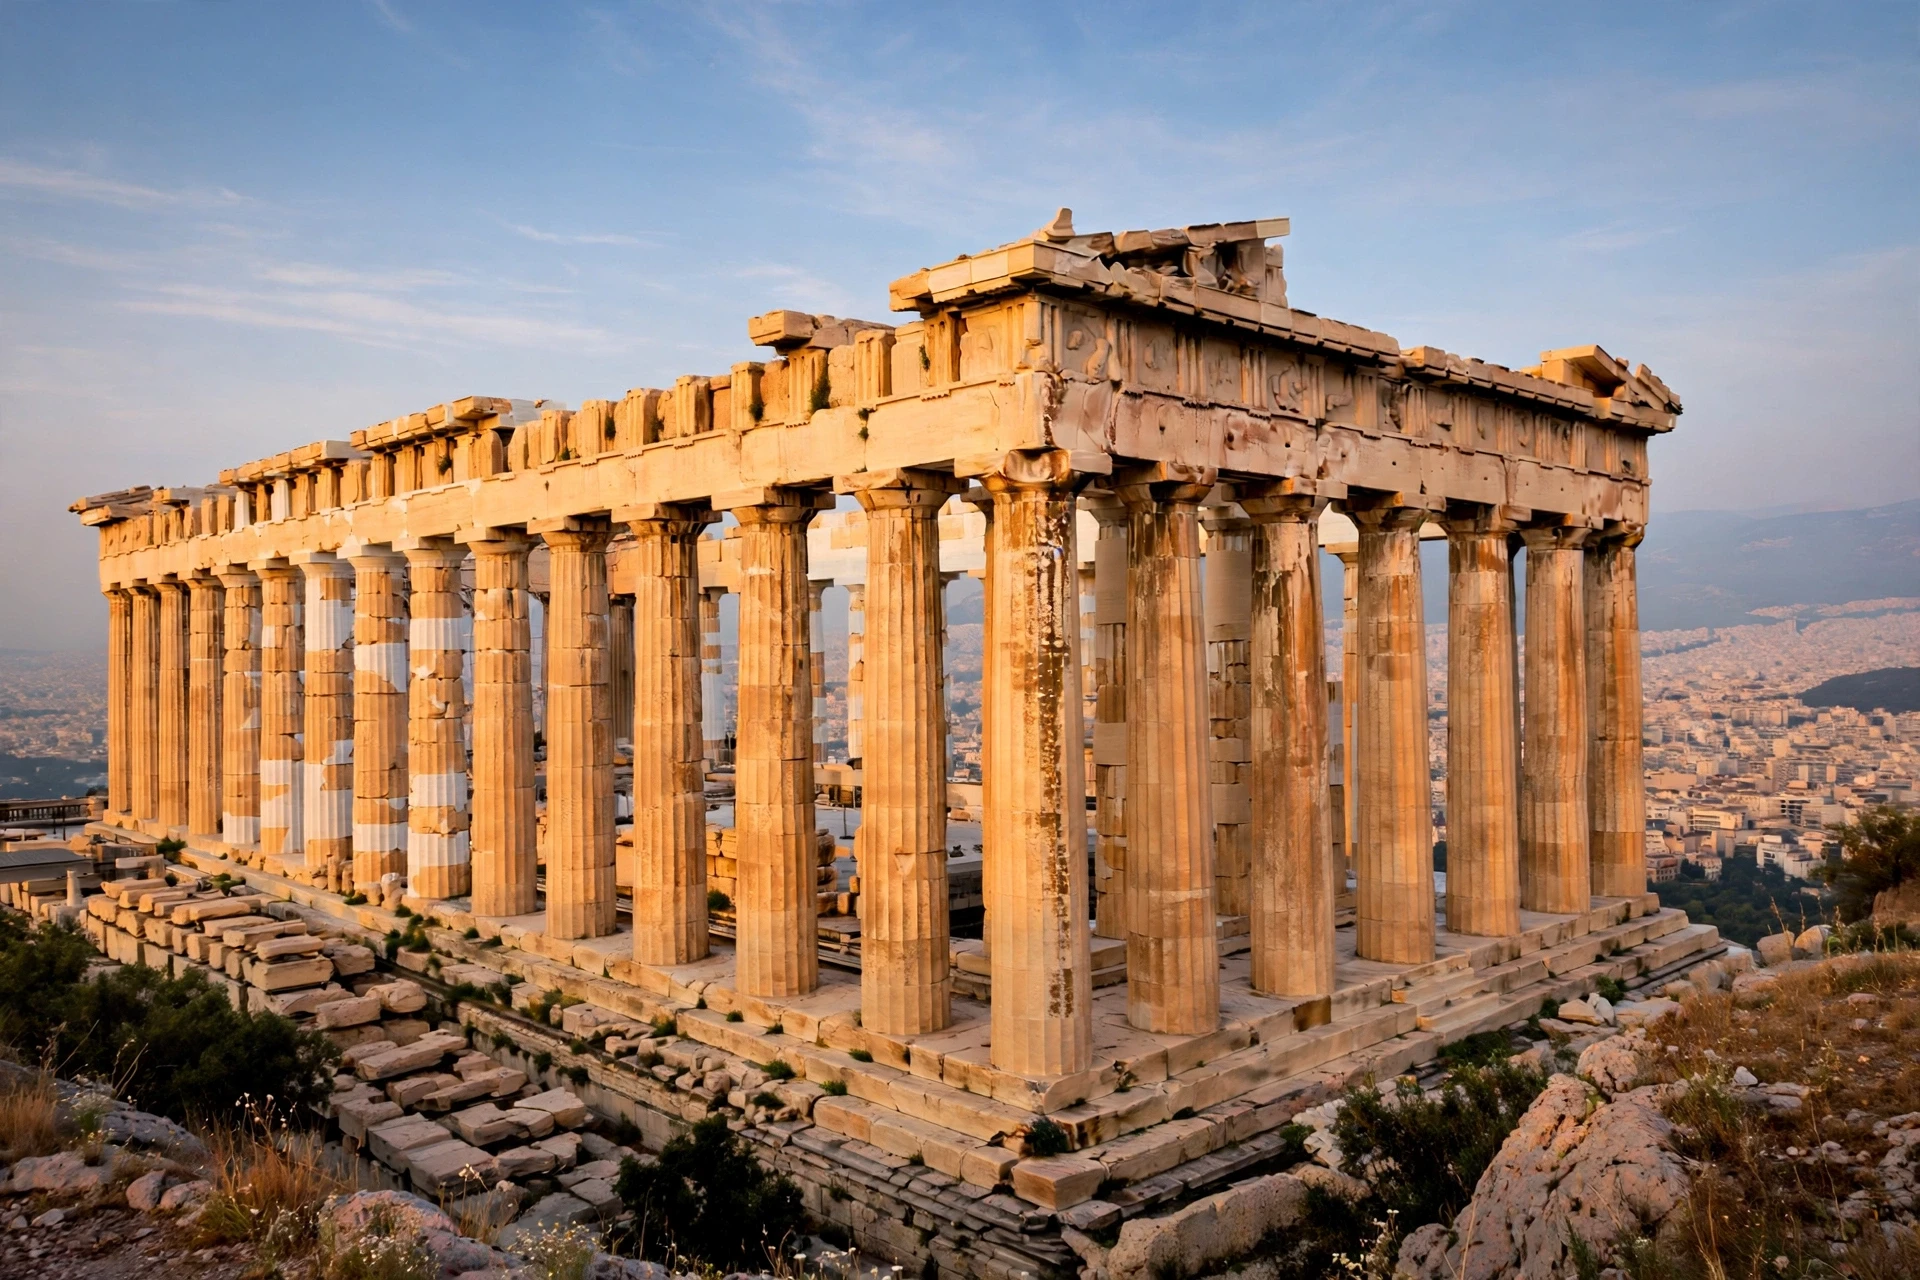
The claim is familiar. The Parthenon, the great temple on the Acropolis in Athens, built between 447 and 432 BCE, is said to be designed around the golden ratio: its façade is a golden rectangle, its columns are spaced in golden proportions, and the whole building embodies a mathematical harmony the Greeks understood and used. It is a beautiful story, and it appears in textbooks, documentaries, and museum guides. It has one problem. There is no documentary evidence for it at all, and the measurements do not support it.
The claim was first made in the 1850s by Adolf Zeising, a German writer who was convinced that the golden ratio was the key to beauty in nature and art. Zeising measured buildings, bodies, plants, and paintings, and found the golden ratio everywhere he looked. The problem is that he was looking two thousand years after the Parthenon was built, with no text, no plan, and no inscription to support him. The Parthenon's architects left no written record of their proportions. Euclid's Elements, which defines the extreme and mean ratio, was written around 300 BCE — more than a century after the Parthenon was finished. The builders could not have been working from Euclid's definition, because it did not exist yet.
And the measurements themselves do not cooperate. The mathematician and astronomer Mario Livio checked them in his book The Golden Ratio, published in 2002. The Parthenon is 101 feet 3.75 inches wide and 45 feet 1 inch high, which gives a ratio of about 2.25 — not 1.618. Measure to the top of the roof, 59 feet, and the ratio is about 1.72 — closer, but still not 1.618, and now you have changed what you are measuring to get closer to the answer. The popular drawings that show a golden rectangle around the façade achieve their fit by choosing what to include: the steps or not, the pediment or not, just the columns or the whole building. Change the choice and the ratio changes. As the mathematician George Markowsky pointed out in 1992, in a paper called "Misconceptions about the Golden Ratio", the rectangle appears only if you cherry-pick what goes inside it.
There is a second, deeper problem. The Parthenon's columns bulge slightly in the middle — a refinement called entasis, designed to correct an optical illusion that makes straight columns look concave — and the platform the temple stands on curves gently upwards. That means an exact rectangle cannot even be defined on the façade to better than about one percent, which is too imprecise to establish a golden rectangle. And the building's documented proportions are not golden at all. The width-to-length ratio of the Parthenon is 4 to 9, a simple whole-number ratio. A careful analysis by Anne Bulckens, in her doctoral research, found that the building's dimensions are whole-number multiples of a single module — 857.6 millimetres, the average width of a triglyph, the grooved blocks in the frieze — and that the proportions follow the Pythagorean musical scale, with the ratio 3 to 2, the musical fifth, as the key. Her analysis discredits the golden-mean hypothesis within its error tolerance. The Parthenon is a masterpiece of proportion. Its proportions are whole numbers and musical intervals, not the golden ratio.
The Mona Lisa fails the same test, in a different medium. Leonardo da Vinci illustrated Luca Pacioli's De Divina Proportione, the book that called the ratio the divine proportion, so it is tempting to suppose he used the ratio in his own paintings. But no document shows that he did. Nobody agrees where a golden rectangle around the Mona Lisa's face should start and end — at the chin or the hairline, at the eyes or the shoulders — and with dozens of points to measure from, and a tolerance that accepts 1.5 or 1.7 as "close enough", the method that finds φ in the Mona Lisa would find it in almost any painting. A claim needs a measurement made before the rectangle is drawn, not after, and a reason the painter would have chosen that rectangle. The Mona Lisa claim has neither.
Both claims fail the same general test, and the test is worth stating plainly, because you will need it every time you meet a golden-ratio claim about a building or a painting. A building or a painting offers dozens of measurable distances: heights, widths, spacings, the distance between this point and that point. Each pair of distances gives a ratio. With enough pairs, some will land near 1.6 by chance — just as, if you throw enough darts, some will land near the bullseye. Finding a ratio near 1.618 among dozens of measurements proves nothing. What proves something is a measurement made before the rectangle is drawn, a document that says the builder chose that proportion, or a pattern that repeats across many buildings by the same hand. The Parthenon and the Mona Lisa have none of those. The sunflower has all three: hundreds of counts, a mechanism, and a reason.
Keith Devlin, writing about the Parthenon, put it simply: "I am not convinced that the Parthenon has anything to do with the Golden Ratio." He is right, and the building is no less magnificent for it. The Parthenon does not need the golden ratio. It has its own proportions, whole numbers and musical fifths, and they are beautiful on their own terms.
11. Where Artists Really Did Use It
If the Parthenon and the Mona Lisa are myths, does that mean no artist ever used the golden ratio on purpose? No. Some did — and the difference between the real cases and the myths is exactly what makes them worth studying. The real cases are documented before the work, not measured after it.
The clearest case is Le Corbusier, the Swiss-French architect who dominated twentieth-century modernism. In 1948 he published Le Modulor, a system of proportions based on the human body and the golden ratio. The Modulor starts with a man 1.83 metres tall — six feet — whose raised hand reaches 2.26 metres and whose navel sits at 1.13 metres. From those measurements Le Corbusier built two series of numbers. The red series runs 27, 43, 70, 113, 183, 296 centimetres. The blue series runs 53, 86, 140, 226, 366 centimetres. The red series is built the way the Fibonacci sequence is built — each term is the sum of the two before it. The blue series is the red series doubled, rounded to whole centimetres, so it is only approximately additive — 53 + 86 is 139, published as 140. In both series each step is about 1.618 times the one before. The two series are woven together into a single scale, and Le Corbusier used that scale to set the dimensions of his buildings: the heights of ceilings, the widths of windows, the spacing of rooms.
He used it in the Unité d'Habitation in Marseille, the great housing block built between 1947 and 1952, where the Modulor sets the proportions of the apartments, the corridors, and the roof terrace. He used it again in the chapel at Ronchamp and in the monastery of La Tourette. And he wrote about it, published it, and taught it — so there is no doubt about his intention, and no need to measure anything after the fact. The Modulor is the golden ratio as a design tool: a system, published in a book, applied to buildings you can still visit.
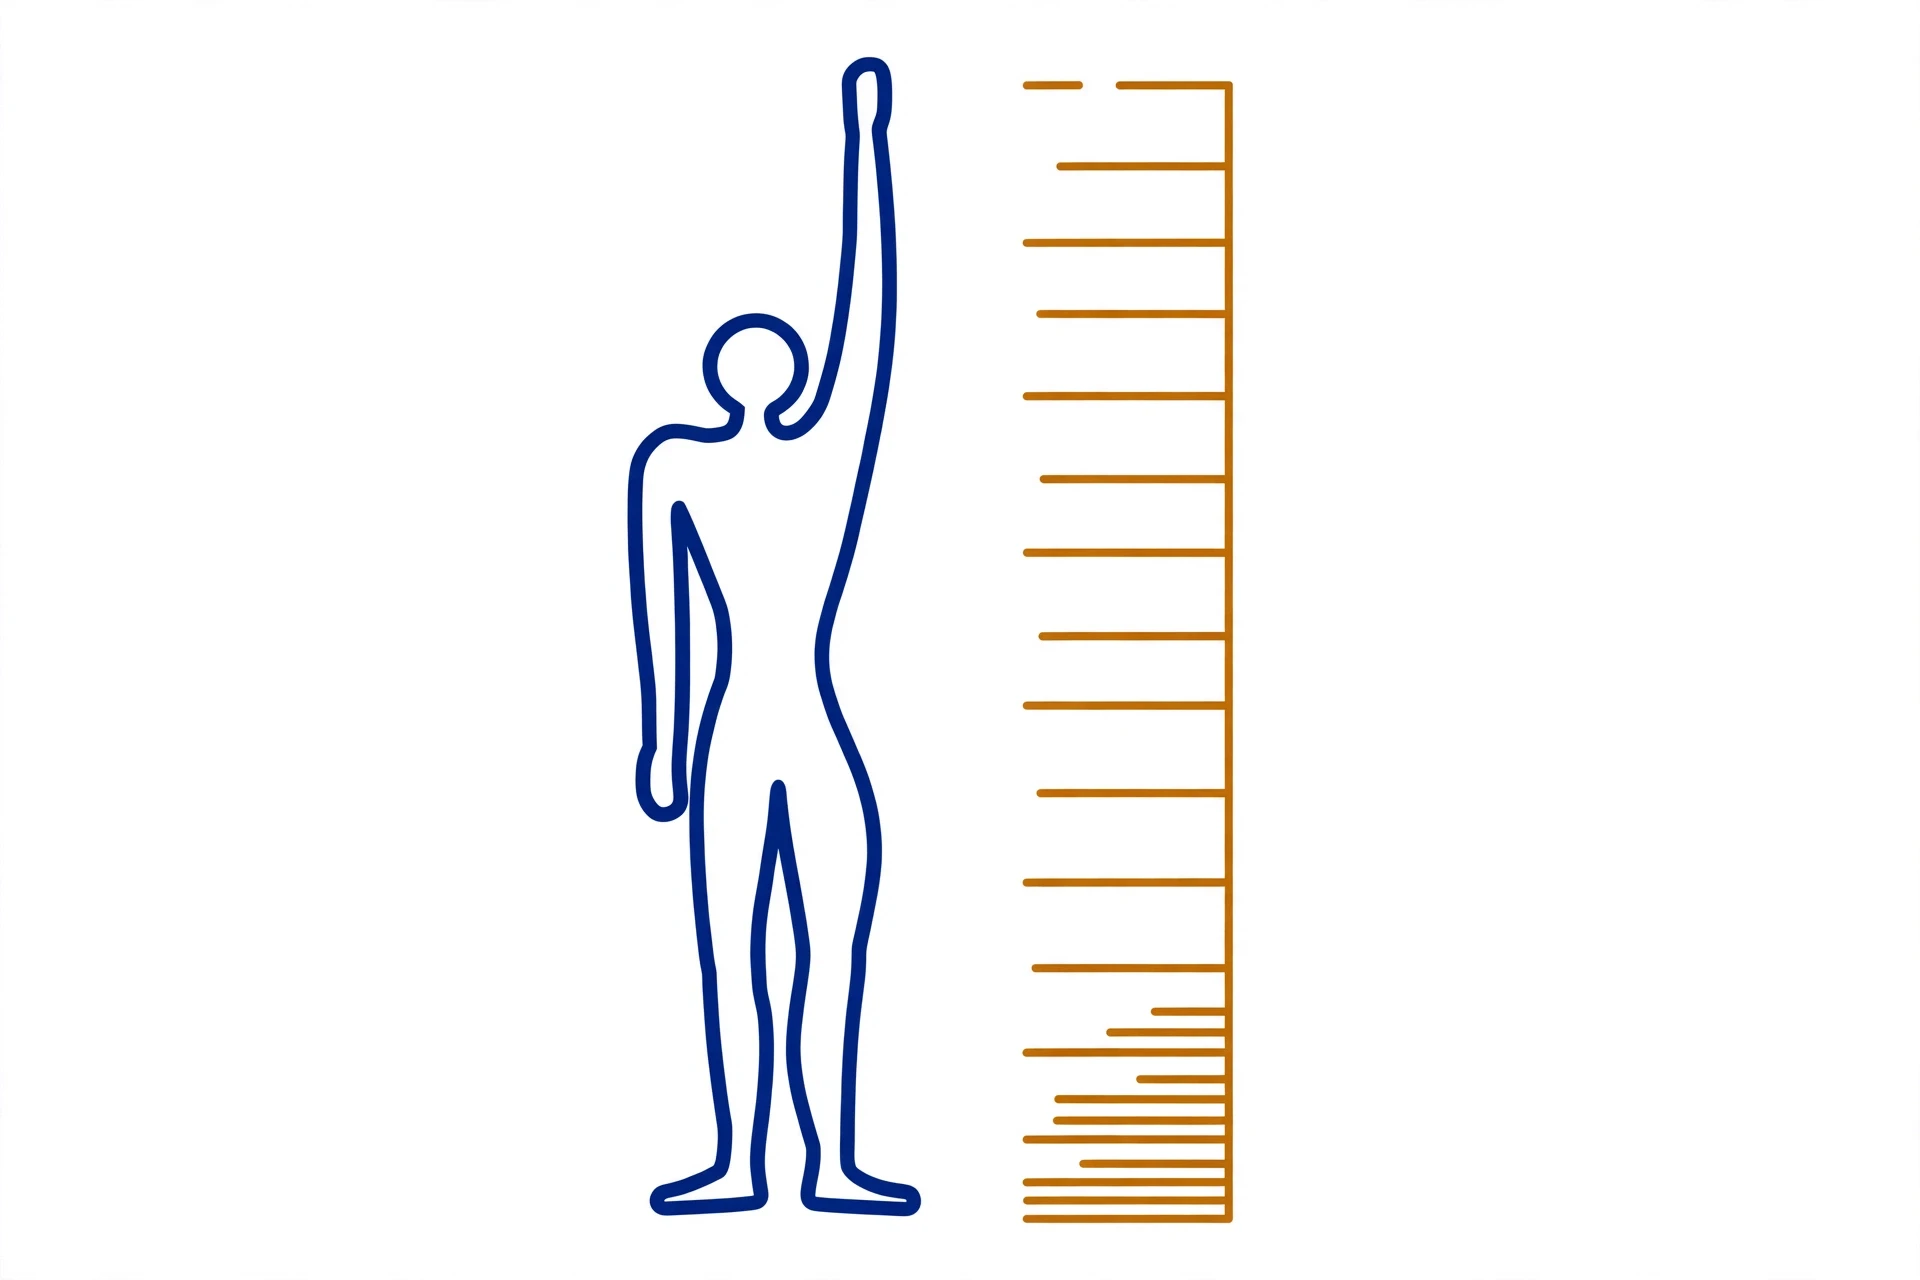
There is a charming detail in the Modulor's history. Le Corbusier's first version of the figure was 1.75 metres tall, not 1.83. He changed it, partly because 1.83 metres is six feet, and the numbers came out round in feet and inches. That is a reminder that the Modulor, like all design systems, was a human choice, not a law of nature — a tool an architect picked up because it was useful, not because the universe demanded it.
The second documented case is Salvador Dalí. In 1955, Dalí painted The Sacrament of the Last Supper on a canvas of about 167 by 267 centimetres — a ratio of about 1.60, close to φ — and he placed a large dodecahedron, a twelve-sided solid, floating above the table. The dodecahedron matters, because its geometry is built on the golden ratio: the ratio of its edges to the radius of its circumscribed sphere involves φ, and its faces are pentagons, whose diagonals are in the ratio φ to their sides. Dalí knew this, wrote about it, and chose the canvas size and the solid deliberately. Again, the evidence is the artist's own words and choices, not a rectangle drawn afterwards by an enthusiast.
The third case is the oldest, and it is the one that connects this section to the beginning of the article. Luca Pacioli's De Divina Proportione, printed in Venice in 1509, was the first book to treat the golden ratio as a subject in its own right, and Leonardo da Vinci drew its illustrations — intricate drawings of polyhedra, including the dodecahedron and the icosahedron, whose geometry depends on φ. The book called the ratio divine, and the illustrations made it visible. What the book did not do is show Leonardo using the ratio in his paintings, and that distinction matters. Illustrating a mathematical book is one thing. Composing the Mona Lisa around a golden rectangle is another, and the evidence for the second does not exist.
A clear account of the difference between documented use and retrofitted measurement is given by Mentua, which walks through the Parthenon, the Mona Lisa, the Modulor, and Dalí, and sorts the claims into the ones with evidence and the ones without. The sorting rule is simple, and it is the rule this article has used throughout: was the proportion chosen before the work, and is there a document that says so? Le Corbusier published his system. Dalí wrote about his canvas. Pacioli printed his book. The Parthenon has no document, the Mona Lisa has no document, and the nautilus has no document — only a picture, copied from a picture, copied from a film.
That rule is also the reason the golden ratio in art is genuinely interesting. It is not interesting because a secret number governs all beauty. It is interesting because a few artists, in full knowledge of what they were doing, picked up a mathematical tool and made something with it — and because the tool they picked up is the same one a sunflower uses to pack its seeds. The number connects a housing block in Marseille to a flower in a garden, not by magic, but by geometry.
12. Fibonacci at Work: Computers, Codes, and Markets
The Fibonacci numbers do not only grow in gardens. They work for a living — in computer science, in coding theory, and, more controversially, in financial markets. The three cases are worth separating, because the first two are solid mathematics and the third is a cautionary tale.
Start with computers. In 1984, Michael Fredman and Robert Tarjan introduced a data structure called the Fibonacci heap, used to implement priority queues — the structures that decide which task a computer does next, or which route a navigation system tries first. The Fibonacci heap's running times are analysed with Fibonacci numbers: the size of a tree in the heap is bounded by Fibonacci numbers, and that bound is what makes the structure fast. The name is not decorative. The numbers are in the proof.
A second example is Fibonacci search, a method for finding an item in a sorted list. Where binary search always splits the list in half, Fibonacci search splits it at Fibonacci-number positions, which can be faster when the list is stored on a disk or another medium where jumping to a position costs more than reading the next one. And a third is an old theorem with a famous consequence: in 1844, Gabriel Lamé proved that the number of steps in Euclid's algorithm — the ancient method for finding the greatest common divisor of two numbers — is at most five times the number of digits of the smaller number, and that the worst case, the pair of numbers that makes the algorithm work hardest, is two consecutive Fibonacci numbers. Euclid's algorithm, in its extended form, is the tool RSA uses to compute a private key from a public one — RSA is the system that protects most of the internet — so the Fibonacci numbers sit quietly at the heart of a piece of mathematics that keeps secrets safe. Our article on how encryption works explains RSA itself; here, the point is that the Fibonacci connection is not a curiosity. It is a theorem, and it has been a theorem since 1844.
Coding theory gives a fourth example. Zeckendorf's theorem, published in 1972, says that every positive integer can be written uniquely as a sum of non-consecutive Fibonacci numbers, using the sequence starting 1, 2, 3, 5, 8, and so on. For example, 100 = 89 + 8 + 3 — and no other combination of non-consecutive Fibonacci numbers adds up to 100. That uniqueness is the basis of Fibonacci coding, a universal code used in data compression: a way of writing numbers so that a computer can tell where one number ends and the next begins without any extra marker. The rabbit puzzle, turned into a code.
Now the cautionary tale: the financial markets. Traders use a tool called Fibonacci retracement. Take a price that has risen from a low to a high, then fallen back. The trader draws horizontal lines at 23.6 percent, 38.2 percent, 50 percent, 61.8 percent and 78.6 percent of the rise, and expects the price to pause or reverse at one of those lines. The levels come from Fibonacci ratios: 61.8 percent is 1/φ, the ratio 55/89; 38.2 percent is 1/φ², the ratio 34/89; 23.6 percent is 1/φ³. The mathematics behind the ratios is solid — those really are the numbers you get from φ and the Fibonacci sequence.
But one of the levels is not a Fibonacci ratio at all. Fifty percent is fifty percent: it is the midpoint, and it has nothing to do with φ or Fibonacci. Its presence in the list is a quiet admission that the tool is partly a convention — traders use 50 percent because round numbers matter to traders, not because the mathematics says so. And the deeper question is whether prices actually respect these levels. The honest answer is that the evidence is weak. The best-controlled backtests — the ones that compare Fibonacci levels against randomly placed control lines — find no reliable difference in how often prices pause at them, though the literature is mixed and some studies report clustering at the 61.8 percent level. What the levels do, reliably, is give thousands of traders the same lines to watch, and when thousands of traders watch the same lines, prices sometimes pause there because traders act there. That is a self-fulfilling prophecy, not a law of nature — a market convention, dressed in mathematics.
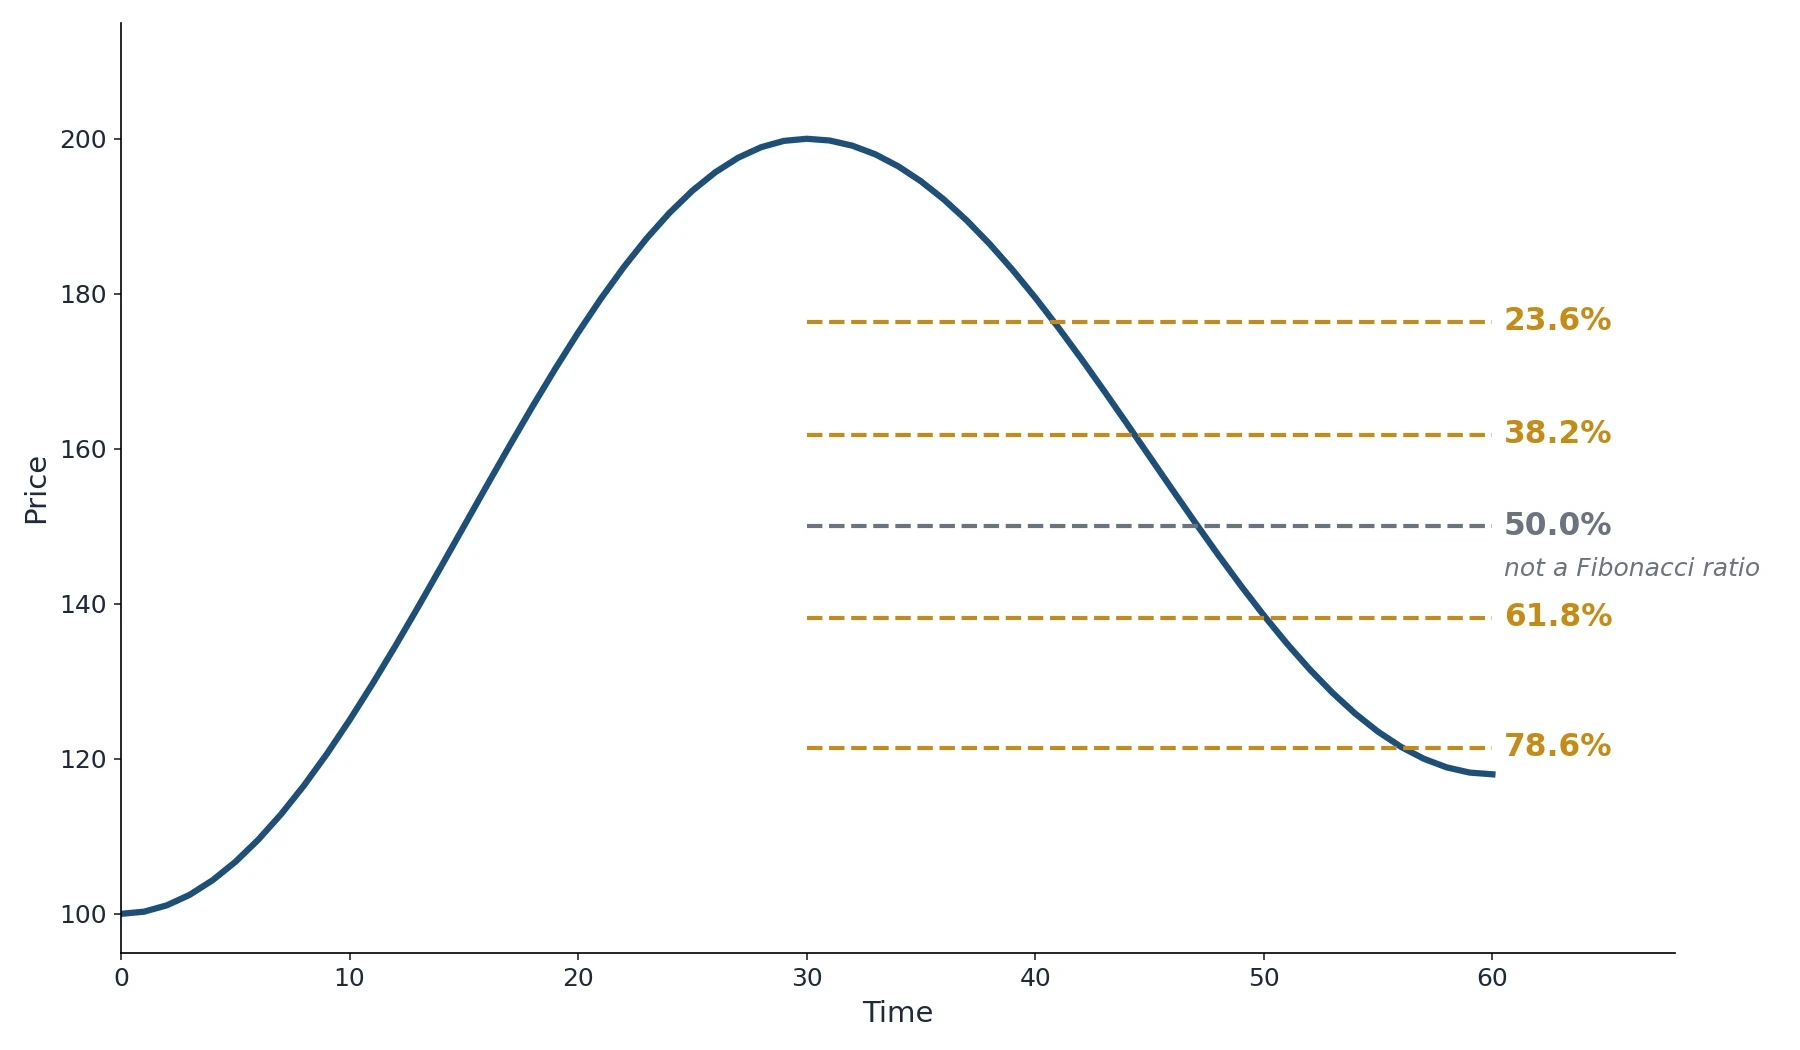
I once watched a trader draw these lines on a chart and speak about them with the same reverence people reserve for the sunflower. The lines were neat, the ratios were exact, and the chart, for a few minutes, seemed to respect them. Then it did not. The difference between the Fibonacci heap and the Fibonacci retracement is the difference between a theorem and a habit: the heap's running time is proved, and the proof uses Fibonacci numbers; the retracement's power is believed, and the belief uses Fibonacci numbers. Both involve the same sequence. Only one of them is mathematics.
That distinction — between a number that appears because the structure demands it and a number that appears because people keep drawing it — is the thread that runs through this whole article. The sunflower's spirals are demanded by the geometry of packing. The Fibonacci heap's running time is demanded by the structure of the data. The nautilus shell's ratio is not demanded by anything, and neither is the Parthenon's. Learning to tell those cases apart is the real skill, and it is the skill the next section is about.
13. Does Beauty Follow the Ratio?
We have arrived at the question that started all of this, and it is the hardest one in the article. Is the golden ratio beautiful? Do people prefer it — prefer a rectangle in the ratio 1.618 to 1 over other rectangles, prefer a face or a building that follows it? The posters say yes. The experiments say something more complicated.
Controlled experiments have not found a consistent human preference for golden rectangles. When researchers show people a set of rectangles of different proportions and ask which they find most pleasing, the golden rectangle does not reliably win. Sometimes it does well; sometimes a rectangle in the ratio 1.5 to 1, or 1.75 to 1, or the square itself, does better; and the results shift with context, with framing, and with familiarity. George Markowsky reviewed the preference literature in his 1992 paper and found the claims of a universal golden preference unsupported: φ has no demonstrated perceptual superiority over other ratios. People do have preferences among proportions — we are not indifferent — but the winner is not reliably 1.618, and the evidence for the golden ratio holding a special place in human visual taste is mixed: early experiments found some preference for it, later reviews have been sceptical, and no experiment has settled the question.
That is a disappointing result if you came to this article hoping for a law of beauty. But it is an interesting result if you ask why the law was believed in the first place. Part of the answer is the way our brains work. We are pattern-finding machines, and we are very good at it — too good, sometimes. We notice the hits and forget the misses. We remember the sunflower and forget the one head in five that breaks the rule. We remember the nautilus poster and never measure the shell. We remember the painting that fits the rectangle and forget the hundred that do not. Psychologists call this confirmation bias, and it is one of the most thoroughly documented habits of the human mind. Our article on cognitive biases takes up the full catalogue; here, the point is that the golden ratio is a perfect target for it, because the number is beautiful, the claim is flattering, and the checking is work.
There is a second part to the answer, and it is about how the claim is usually stated. "The golden ratio is beautiful" sounds like a fact about the number. But what people actually test is a fact about a rectangle, or a face, or a building — and a rectangle is not a number. A golden rectangle is 1.618 to 1. A rectangle at 1.6 to 1 is almost the same shape, and the human eye cannot reliably tell them apart. So even if people did prefer golden rectangles, the preference would be a preference for a shape, not for a number — and the shape would have to be distinguished from its near neighbours, which no experiment has managed to do cleanly.
That does not mean the golden ratio is ugly, or that it has no place in art. Le Corbusier used it, and his buildings are beautiful. Dalí used it, and his painting is striking. But they are beautiful for many reasons — light, material, composition, colour, the intelligence of the whole — and the golden ratio is one ingredient among many, not the secret that explains the rest. A cake is not delicious because of the salt. The salt matters, and the cake would be worse without it, but the salt is not the explanation of the cake.
There is also a humbler way to think about the question, and it is the way the mathematician's answer usually goes. The golden ratio is beautiful as mathematics: a simple definition, a surprising connection to a rabbit puzzle, a number that is the hardest to approximate with fractions, a spiral that builds itself out of squares. That beauty is real, and it does not need a poll of rectangle preferences to support it. It is the beauty of a structure that fits together, the way a proof fits together, or the way a sunflower's seeds fit together. The mistake was in taking that mathematical beauty and turning it into a claim about human taste — and then into a claim about nature, and then into a claim about everything.
Our article on how we make decisions describes the two speeds of human thought: the fast, intuitive system that spots a pattern and feels certain, and the slow, deliberate system that checks the pattern and counts. The golden ratio myth is a triumph of the fast system. It feels right, it looks right, and it arrives with a beautiful picture attached. The slow system — the one that measures eighty shells, counts 657 sunflowers, and asks for the document — is slower and less fun. But it is the system that found the sunflower was real and the nautilus was not, and that is a better story than the poster ever told.
And there is a final twist, which brings us back to the probability article that preceded this one. The question "is the golden ratio beautiful?" is, in the end, a question about evidence, and evidence is a matter of counting: how many rectangles were tested, how many shells were measured, how many sunflowers were counted, and what fraction did not fit. The mathematics of uncertainty — of base rates, of sampling, of the difference between a striking example and a representative one — is the same mathematics whether the subject is a coin toss or a sunflower. Our article on what is probability takes up that mathematics in full. The golden ratio, it turns out, is a lesson in probability as much as a lesson in geometry: a beautiful claim is not a true claim, and the only way to tell the difference is to count.
14. One Rule, Many Children
There is a last piece of the mathematics worth seeing, because it ties the whole article together and it is genuinely lovely. The Fibonacci rule — add the last two — is not the only rule that leads to the golden ratio. It is one member of a family, and every member of the family converges to the same number.
Change the starting numbers and keep the rule. Start with 2 and 1 instead of 1 and 1, and you get the Lucas numbers: 2, 1, 3, 4, 7, 11, 18, 29, 47, 76, 123, 199, and so on. Each term is still the sum of the two before it. And the ratios of consecutive Lucas numbers — 3/1, 4/3, 7/4, 11/7, 18/11 — converge to φ, just as the Fibonacci ratios do. Start with 3 and 1, or 5 and 2, or any two positive numbers at all, and the same thing happens: the ratios close in on φ, alternating above and below, shrinking by a factor of about 2.6 at every step. The golden ratio is not the property of one sequence. It is the property of the rule itself. Any sequence that adds the last two will be pulled towards φ, whatever it starts from.
That is why the Lucas numbers turned up in the 2016 sunflower census: 41 of the 768 spiral counts were Lucas numbers, not Fibonacci numbers. The plant's growth rule produces the same kind of sequence from different starting conditions, and the census caught it. The rule is the thing. The starting numbers are an accident.
There is a second family, and it is even stranger. Zeckendorf's theorem says that every positive integer can be written uniquely as a sum of non-consecutive Fibonacci numbers. Take 100: it is 89 + 8 + 3, and there is no other way to write 100 as a sum of Fibonacci numbers with no two neighbours. Take 17: it is 13 + 3 + 1. Take 1,000: it is 987 + 13. Every number has exactly one such representation, and the representation is a kind of fingerprint — a way of writing any number in the Fibonacci system, the way decimal writes numbers in tens. That uniqueness is what makes Fibonacci coding work, and it is a reminder that the sequence is not just a list of numbers. It is a whole number system, hiding inside the integers.
And there is a third family, the shapes. The golden triangle — a triangle whose sides are in the ratio φ to 1 — appears inside the pentagram, and the pentagram appears inside the pentagon, and the pentagon's diagonal is φ times its side. Cut a golden triangle in a particular way and you get a smaller golden triangle, and a golden gnomon, the leftover piece, and the pieces tile together in a spiral that winds inwards forever. The same self-similarity as the rectangle, in a different shape. The golden ratio is not a number with one shape. It is a number with a family of shapes, all built from the same equation, φ² = φ + 1.
Step back, and the picture is this. One rule — add the last two — produces the Fibonacci sequence, the Lucas numbers, and every sequence like them. One equation — φ² = φ + 1 — produces the golden rectangle, the golden spiral, the golden triangle, and the pentagon. One angle — 137.5 degrees — produces the sunflower, the pinecone, and the petals. And one number — 1.618034 — sits at the centre of all of it, because it is the number that solves the equation, and the equation is the rule, and the rule is the geometry. The golden ratio and Fibonacci sequence are not two ideas that happen to meet. They are one idea, seen from the side of arithmetic and the side of geometry, and the meeting point is the equation itself.
That is the real wonder of the subject, and it does not need a myth to support it. The sunflower is real. The nautilus is not. The Parthenon is not. The Modulor is. The Fibonacci heap is. The retracement levels are a convention. And the number at the centre of it all is 1.618034 — irrational, self-similar, the hardest number to approximate with a fraction, and the answer to a question about cutting a line that Euclid asked more than two thousand years ago.
15. Frequently Asked Questions
What is the golden ratio?
The golden ratio, written φ (phi), is the number you get when you cut a line so that the whole line relates to the longer part exactly as the longer part relates to the shorter part. Its value is (1 + √5) / 2, about 1.618034. It is irrational, it satisfies φ² = φ + 1, and its reciprocal is φ − 1, about 0.618034.
What is the Fibonacci sequence?
The Fibonacci sequence is 1, 1, 2, 3, 5, 8, 13, 21, 34, 55, 89, 144, and so on — each term is the sum of the two before it. It was introduced to Europe by Leonardo of Pisa, called Fibonacci, in his book Liber Abaci in 1202, through a puzzle about breeding rabbits.
How are Fibonacci numbers related to the golden ratio?
The ratio of consecutive Fibonacci numbers converges to the golden ratio: 2/1 = 2, 3/2 = 1.5, 5/3 ≈ 1.667, 8/5 = 1.6, 13/8 = 1.625, and by 233/144 the value is 1.618056, within 0.000022 of φ. The ratios alternate above and below φ and close in fast. The reason is algebraic: if the ratio settles at q, the Fibonacci rule becomes q = 1 + 1/q, whose positive root is φ.
Does the golden ratio appear in nature?
Yes — in plants. Sunflower heads, pinecones, pineapples and many flowers show Fibonacci numbers in their spiral counts and petal counts, because new parts form at the golden angle of about 137.5 degrees, which packs them most evenly. A 2016 census of 657 sunflowers found Fibonacci structure in 82.3 percent of spiral counts — but 17.7 percent had none, so the pattern is real, not universal.
Is the nautilus shell a golden spiral?
No. The nautilus shell is a logarithmic spiral, but it grows by a factor of about 3 per full turn, where a golden spiral would grow by about 6.85. Christopher Bartlett measured 80 shells and found an average length-to-height ratio of about 1.31, not 1.618. The claim was popularised by a Disney film in 1959 and by The Da Vinci Code in 2003.
What is the golden angle?
The golden angle is about 137.5077 degrees — the smaller arc when a full turn is divided in the golden ratio. Plants use it (without knowing it) when they add new parts one at a time around a growing tip, because it is the angle whose fraction of a turn is hardest to approximate with simple fractions, so new parts never line up on spokes and never leave gaps.
Where is the golden ratio used?
Deliberately, in art and design: Le Corbusier's Modulor system (1948) is built on it, and Dalí used it in The Sacrament of the Last Supper (1955). In computing: the Fibonacci heap, Fibonacci search, and Zeckendorf coding all use Fibonacci numbers. In trading, Fibonacci retracement levels are drawn on charts — but the best-controlled backtests find no reliable predictive edge over randomly placed lines, so that use is a market convention, not a law.
Is the golden ratio in the Parthenon?
There is no evidence for it. The claim was first made in the 1850s, two thousand years after the building, and the measurements give ratios of about 2.25 or 1.72, depending on what is measured — not 1.618. The Parthenon's documented proportion is 4:9, width to length, and its dimensions follow a whole-number module and the Pythagorean musical scale.
16. Sources
- Wikipedia, Golden ratio — https://en.wikipedia.org/wiki/Golden_ratio
- Wikipedia, Fibonacci sequence — https://en.wikipedia.org/wiki/Fibonacci_sequence
- Encyclopaedia Britannica, Golden ratio — https://www.britannica.com/topic/golden-ratio
- MathWorld, Golden Ratio — https://mathworld.wolfram.com/GoldenRatio.html
- Plus Maths (University of Cambridge), The golden ratio — https://plus.maths.org/content/golden-ratio
- Science Friday, Myth or math? Is the nautilus shell's golden ratio real? — https://www.sciencefriday.com/educational-resources/nautilus-shell-golden-ratio/
- Bartlett, C., The Design of the Nautilus Shell, Nexus Network Journal, 2019 — https://doi.org/10.1007/s00004-018-0419-3
- Markowsky, G., Misconceptions about the Golden Ratio, The College Mathematics Journal, 23(1), 1992 — https://doi.org/10.2307/2686193
- Swinton, J., Ochu, E., and the MSI Turing's Sunflower Consortium, Novel Fibonacci and non-Fibonacci structure in the sunflower: results of a citizen science experiment, Royal Society Open Science, 3: 160091, 2016 — https://doi.org/10.1098/rsos.160091
- Swinton, J., Ochu, E., et al., Sunflower paper (full text), Royal Society Open Science, 2016 — https://pmc.ncbi.nlm.nih.gov/articles/PMC4892450/
- Vogel, H., A better way to construct the sunflower head, Mathematical Biosciences, 44: 179–189, 1979 — https://doi.org/10.1016/0025-5564(79)90080-4
- That's Maths (Irish Times), Sunflowers and Fibonacci: Models of Efficiency — https://thatsmaths.com/2014/06/05/sunflowers-and-fibonacci-models-of-efficiency/
- Mentua, What Is the Golden Ratio, and Is It Really in Art? — https://mentua.org/what-is-the-golden-ratio-and-is-it-really-in-art/
- Mathsy, The golden ratio is mostly a lie — https://www.mathsy.io/articles/golden-ratio-on-trial/
- Geschichte der Mathematik, Fibonacci Sequence: Formula, List, Spiral and Nature — https://geschichtedermathematik.de/en/fibonacci-sequence/
- Wikipedia, Modulor — https://en.wikipedia.org/wiki/Modulor
- Science, Sunflowers show complex Fibonacci sequences — https://www.science.org/content/article/sunflowers-show-complex-fibonacci-sequences
- James Gurney, The Golden Mean — https://jamesgurney.substack.com/p/the-golden-mean
- Euclid, Elements, c. 300 BCE (Book VI, Definition 3: extreme and mean ratio) (print citation)
- Fibonacci (Leonardo of Pisa), Liber Abaci, 1202 (print citation)
- Pacioli, L., De Divina Proportione, Venice, 1509 (print citation)
- Kepler, J., De Nive Sexangula (On the Six-Cornered Snowflake), 1611 (print citation)
- Livio, M., The Golden Ratio: The Story of Phi, the World's Most Astonishing Number, 2002 (print citation)
- Le Corbusier, Le Modulor, 1948 (print citation)
- Devlin, K., The Myth That Will Not Go Away, Mathematical Association of America column, 2007 (print citation)