

The experiment that changed how I think about obesity took place in a locked hospital ward in Bethesda, Maryland. Twenty adults moved in for a month. Every meal was weighed, every crumb accounted for, every minute of their day observed. For two weeks they ate a diet built from ultra-processed foods — the kind that comes in packets and boxes. Then they switched, for two weeks, to a diet of unprocessed foods: vegetables, fruit, meat, eggs, grains cooked from scratch. The two menus were matched for the calories on offer, the sugar, the fat, the salt, the fibre, the protein and carbohydrate. On paper, they were nutritional twins.
The volunteers did not behave like twins. On the ultra-processed menu they ate, on average, 508 more calories a day — without being told to, without trying to, and while insisting they were simply eating until they felt full. In two weeks they gained an average of 0.9 kilograms. On the unprocessed menu they lost the same amount. Nothing about their willpower changed between the two fortnights. What changed was the food environment around a brain that was doing exactly what brains evolved to do.
The first time I read that paper — Kevin Hall and colleagues, published in Cell Metabolism in 2019 — I re-read the methods twice, because the result felt too clean to be true. It was not a survey or a self-report. It was a metabolic ward, the most controlled setting in nutrition science, and the gap it found was enormous: five hundred extra calories a day, appearing out of nowhere, in people who were not trying to overeat. Something was driving their appetite from below conscious control, and the food was pulling the levers.
Three years earlier, a different kind of follow-up had delivered the same message from the opposite direction. Researchers tracked down fourteen former contestants from a televised weight-loss competition, six years after they had lost an average of 58.3 kilograms in thirty weeks. Most had regained a large share of it — 41.0 kilograms on average. But the number that stayed with me was not on the scale. It was in their metabolism. Six years later, their resting metabolic rate was still 704 calories a day below where it had started, and about 499 calories a day of that gap could not be explained by their smaller bodies alone. Their bodies were still burning less, and still hungry, half a decade after the cameras left.
Put those two studies side by side and a puzzle takes shape. The body is not a passive bucket that fills and empties with calories. It is an actively regulated system, with sensors in fat tissue, hormones that report to the brain, and circuits in the hypothalamus that adjust hunger and energy expenditure to defend a weight — mostly against loss. The environment has changed faster than that system can adapt. This article follows the regulation: what obesity is and is not, how common it has become, the hormones leptin and ghrelin, the brain circuits they act on, the idea of leptin resistance, the arithmetic of energy balance, the genes, the environment, and why diets fail so often — and what the new GLP-1 medicines do and do not prove. It is science education, not personal advice. Nothing here tells any individual reader what to eat, what to weigh, or what medicine to take. Those are conversations for a clinician who knows you.
1. Obesity Is a Disease of Regulation, Not a Failure of Willpower
1.1 What "obesity" means in medicine — and what it does not
In medicine, obesity is defined by excess body fat that impairs health — and the working definition the World Health Organization uses starts with body mass index, or BMI: weight in kilograms divided by height in metres squared. A BMI of 25 or above counts as overweight in adults; 30 or above counts as obesity. The formula is simple enough to compute on a phone, and that simplicity is both its strength and its weakness, as the next section shows.
But the definition matters less than the framing that comes with it. The WHO calls obesity "a chronic disease" driven by "complex interactions between environmental, social, biological and behavioural determinants", and describes it as "characterized by dysregulation of neurobiological and metabolic pathways involved in appetite, energy balance and adipose tissue function, with genetic variation influencing individual susceptibility". Read that sentence slowly, because it contains the whole argument of this article. The point is that obesity is a disease of regulation: the systems that are supposed to keep appetite, energy use and fat storage in balance have gone off balance, under pressure from genes, the brain, and an environment that makes weight gain easy. It is not a character diagnosis. Nobody's BMI measures their discipline.
That distinction is not politeness. It changes what counts as an explanation. If weight were simply a matter of choices, then the Hall metabolic-ward result would be impossible: the same people, the same willpower, eating five hundred extra calories a day because the menu changed. If it were simply a matter of choices, the Biggest Loser contestants would have kept the weight off by trying harder — and their resting metabolism would not still be running hundreds of calories below baseline six years later. The evidence points the other way: appetite and expenditure are regulated, and the regulation is powerful.
1.2 BMI: a useful screen, a poor diagnosis
BMI survives because it is cheap, fast and roughly right at the level of whole populations. A clinician can compute it in seconds, and across millions of people it tracks health risk reasonably well. For children and teenagers the cut-offs are different — the WHO defines overweight in ages five to nineteen as a BMI-for-age more than one standard deviation above the WHO Growth Reference median, and obesity as more than two standard deviations above it — and for children under five the thresholds are based on weight-for-height. The details vary by age, but the principle is the same: BMI is a screening tool, a first pass.
What BMI cannot see is the problem. It cannot tell muscle from fat, so a heavily muscled person can score as having obesity while carrying little body fat. It cannot tell where fat sits, and location matters enormously: fat packed around the organs — visceral fat — carries far more metabolic risk than fat under the skin, and two people with the same BMI can carry very different amounts of it. Our companion article on visceral fat versus subcutaneous fat works through that difference in detail. BMI also cannot tell whether excess fat is actually harming anything yet — whether the liver, the pancreas, the joints or the heart are already affected. A number on a chart is not a diagnosis of a person's health, and treating it as one has caused a great deal of unnecessary shame and a great deal of missed disease.
BMI category (adults) | BMI range | What it tells you | What it cannot see |
|---|---|---|---|
Underweight | Below 18.5 | Weight is low for height | Whether the cause is illness, muscle loss or diet |
Healthy weight | 18.5 to 24.9 | Weight is in the range linked to lowest average risk | Fat distribution, muscle mass, organ health |
Overweight | 25 to 29.9 | Weight is above the range linked to lowest average risk | Whether the excess is fat or muscle |
Obesity, class I | 30 to 34.9 | Risk of weight-related disease is raised on average | Whether organs are already affected |
Obesity, class II | 35 to 39.9 | Risk is higher still on average | Fat location or body composition |
Obesity, class III (severe obesity) | 40 and above | Risk is highest on average | Anything about the individual behind the number |
Table 1: BMI categories for adults, and the limits of what a single number can say. BMI is a screening tool, not a diagnosis — which is why the 2025 redefinition described below asks for a second step.
1.3 The 2025 redefinition: clinical vs pre-clinical obesity
In January 2025, a commission convened by The Lancet Diabetes & Endocrinology proposed a change that many clinicians had been waiting for. The proposal, developed by a commission of more than fifty experts and endorsed by scores of medical organisations around the world, keeps BMI — but demotes it. Under the new framework, BMI is only the screen. If the screen is positive, excess body fat must then be confirmed with another measure: waist circumference, a waist-to-hip or waist-to-height ratio, or a direct measure of body fat. Then comes the question that BMI never asked: is the excess fat actually impairing anything?
That question splits obesity into two categories. Clinical obesity means excess fat is already impairing organ function or daily activities — it is a chronic, systemic illness, and it deserves treatment as one. Pre-clinical obesity means excess fat is present but organ function is still preserved, while the risk of future disease is raised — a state that calls for monitoring and risk reduction, not for pretending nothing is wrong. The distinction matters because it separates the people who need medical care now from the people who need support to avoid needing it later, and it does so on the basis of what the fat is doing rather than what the scale says.
A large international study published in Nature in 2026, testing this framework in adults in China, the United Kingdom, the United States and Spain, found that BMI alone misclassified people in both directions — missing obesity-level body fat in some and wrongly labelling others as having obesity — and that obesity was linked to a higher risk of death only when waist measurements were added to BMI, not with BMI alone. The exact percentages in that study are still being checked against the primary paper, so this article will not quote them. But the direction is clear, and it is the direction the commission pointed: measure the waist, measure the fat, and ask what the body is actually experiencing.
1.4 Why the language matters: stigma, blame, and what the evidence says about willpower
Children and teenagers living with overweight or obesity face stigma, discrimination and bullying, and report poorer quality of life and impaired school performance, according to the WHO — and obesity in childhood often persists into adulthood, bringing type 2 diabetes and cardiovascular disease earlier in life. Adults face a quieter version of the same thing: the assumption, made in clinics and workplaces and family kitchens, that weight is a verdict on character. That assumption is not only cruel; it is wrong in a way that makes the problem harder to solve. People who feel blamed avoid clinics, delay care, and internalise a story in which their biology is a personal failure. The science says something else entirely: the systems that regulate weight are real, they are powerful, and they operate mostly below conscious control.
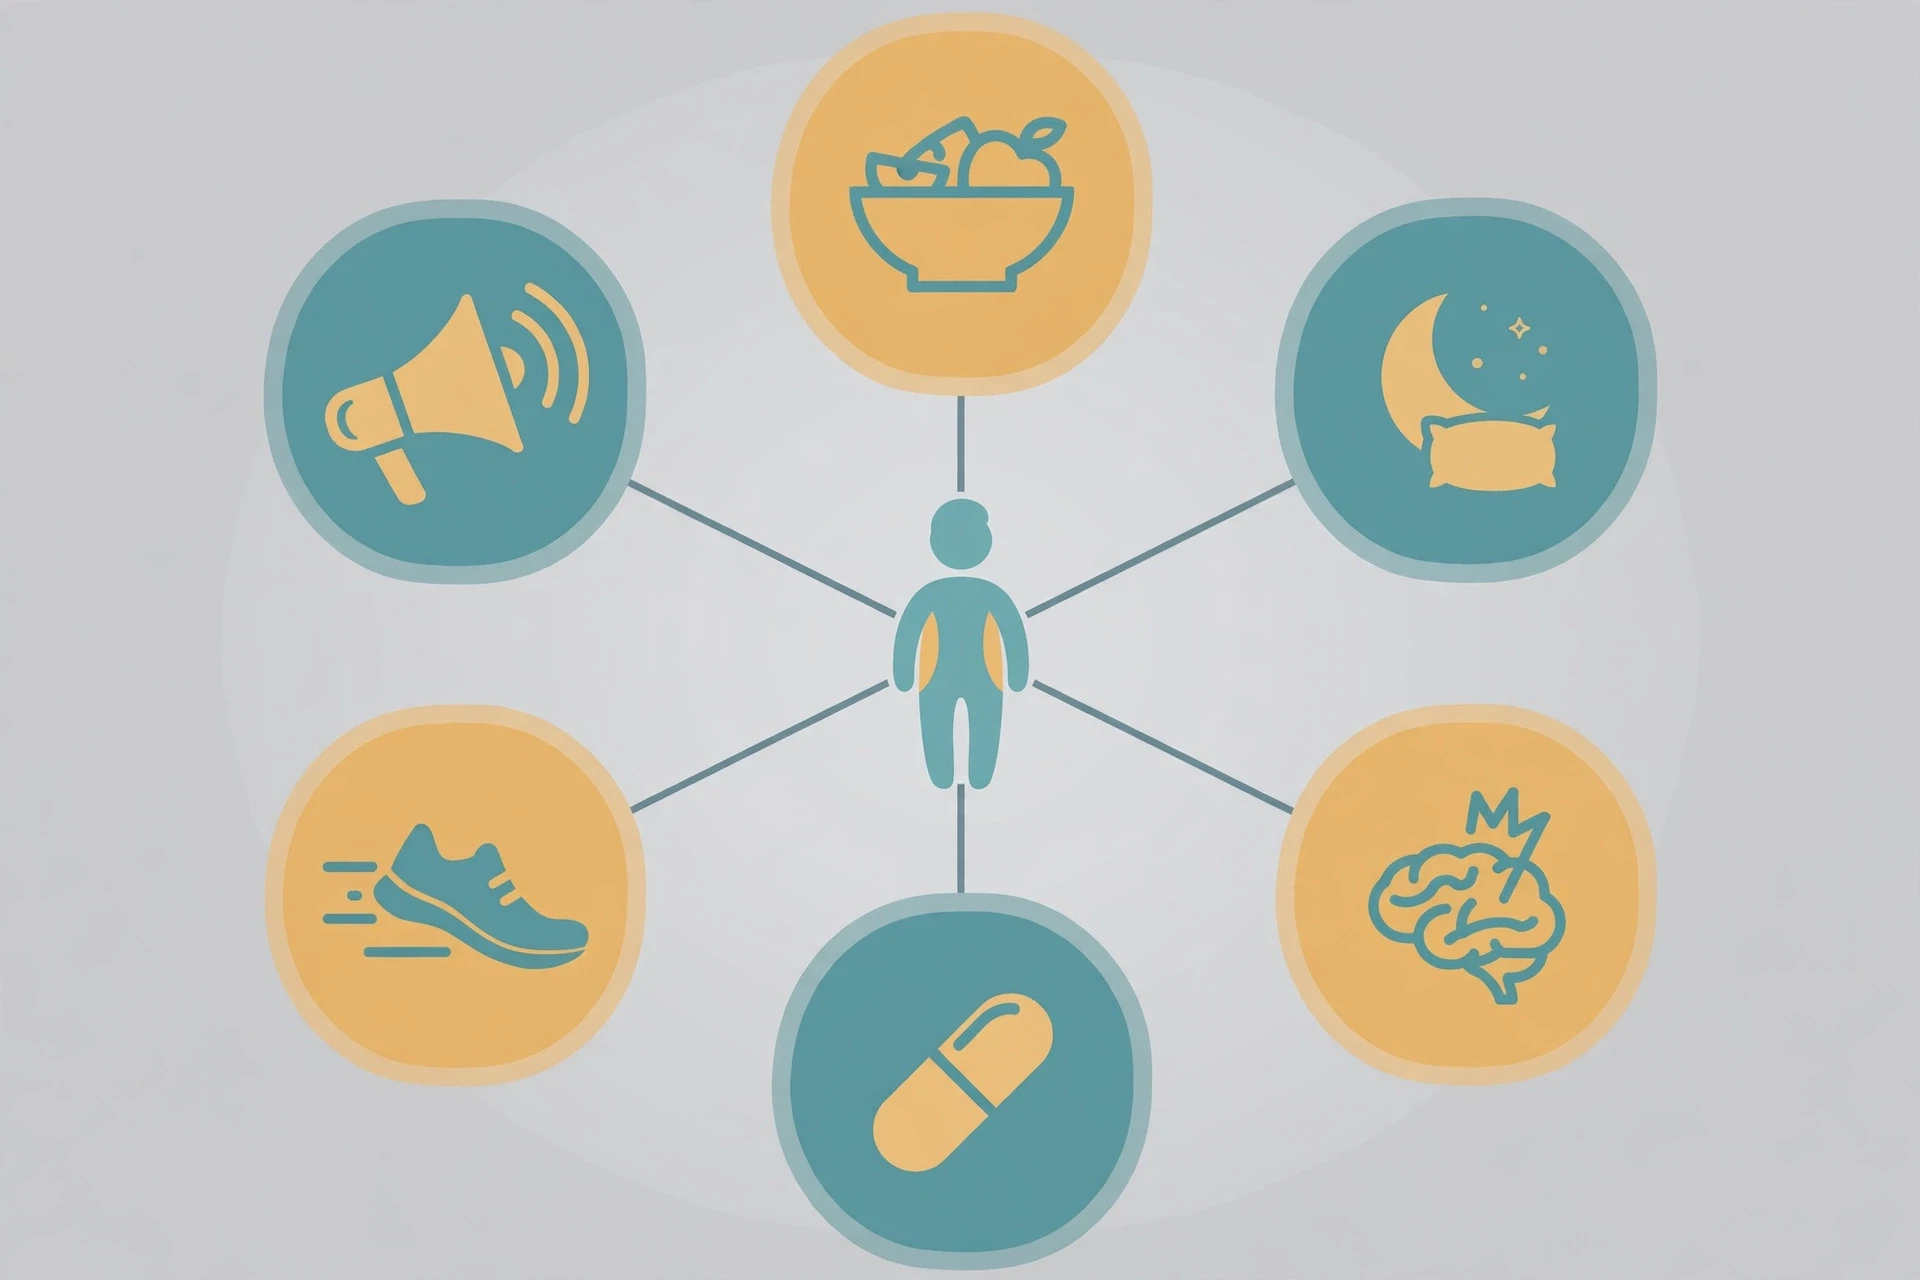
Most people assume that willpower is the main variable in weight — that some people have it and some people do not. What the data actually show is that willpower is a small lever on a large machine. Genes shape appetite and metabolism. Hormones report fat stores to the brain around the clock. The brain defends lost weight with hunger and a slower metabolism. And the environment — the food on offer, the price of it, the hours of sleep people get, the medicines they take — pushes in one direction far more often than the other. None of that makes weight unchangeable. It makes the idea that weight is a simple test of character untenable.
"Obesity is a societal rather than solely an individual responsibility." — World Health Organization, "Obesity and overweight" fact sheet
The WHO's sentence is worth sitting with, because it reframes the whole subject. If obesity is partly a societal matter — shaped by food systems, by the design of cities, by marketing, by sleep and stress and the price of fresh food — then the useful questions change. Not "why can't people control themselves?" but "what is regulating their weight, and what is pushing that regulation in the wrong direction?" The rest of this article tries to answer the second question.
2. How Common Is Obesity? The Latest Numbers
2.1 The world in 2024: 1 in 7 people, 1.1 billion
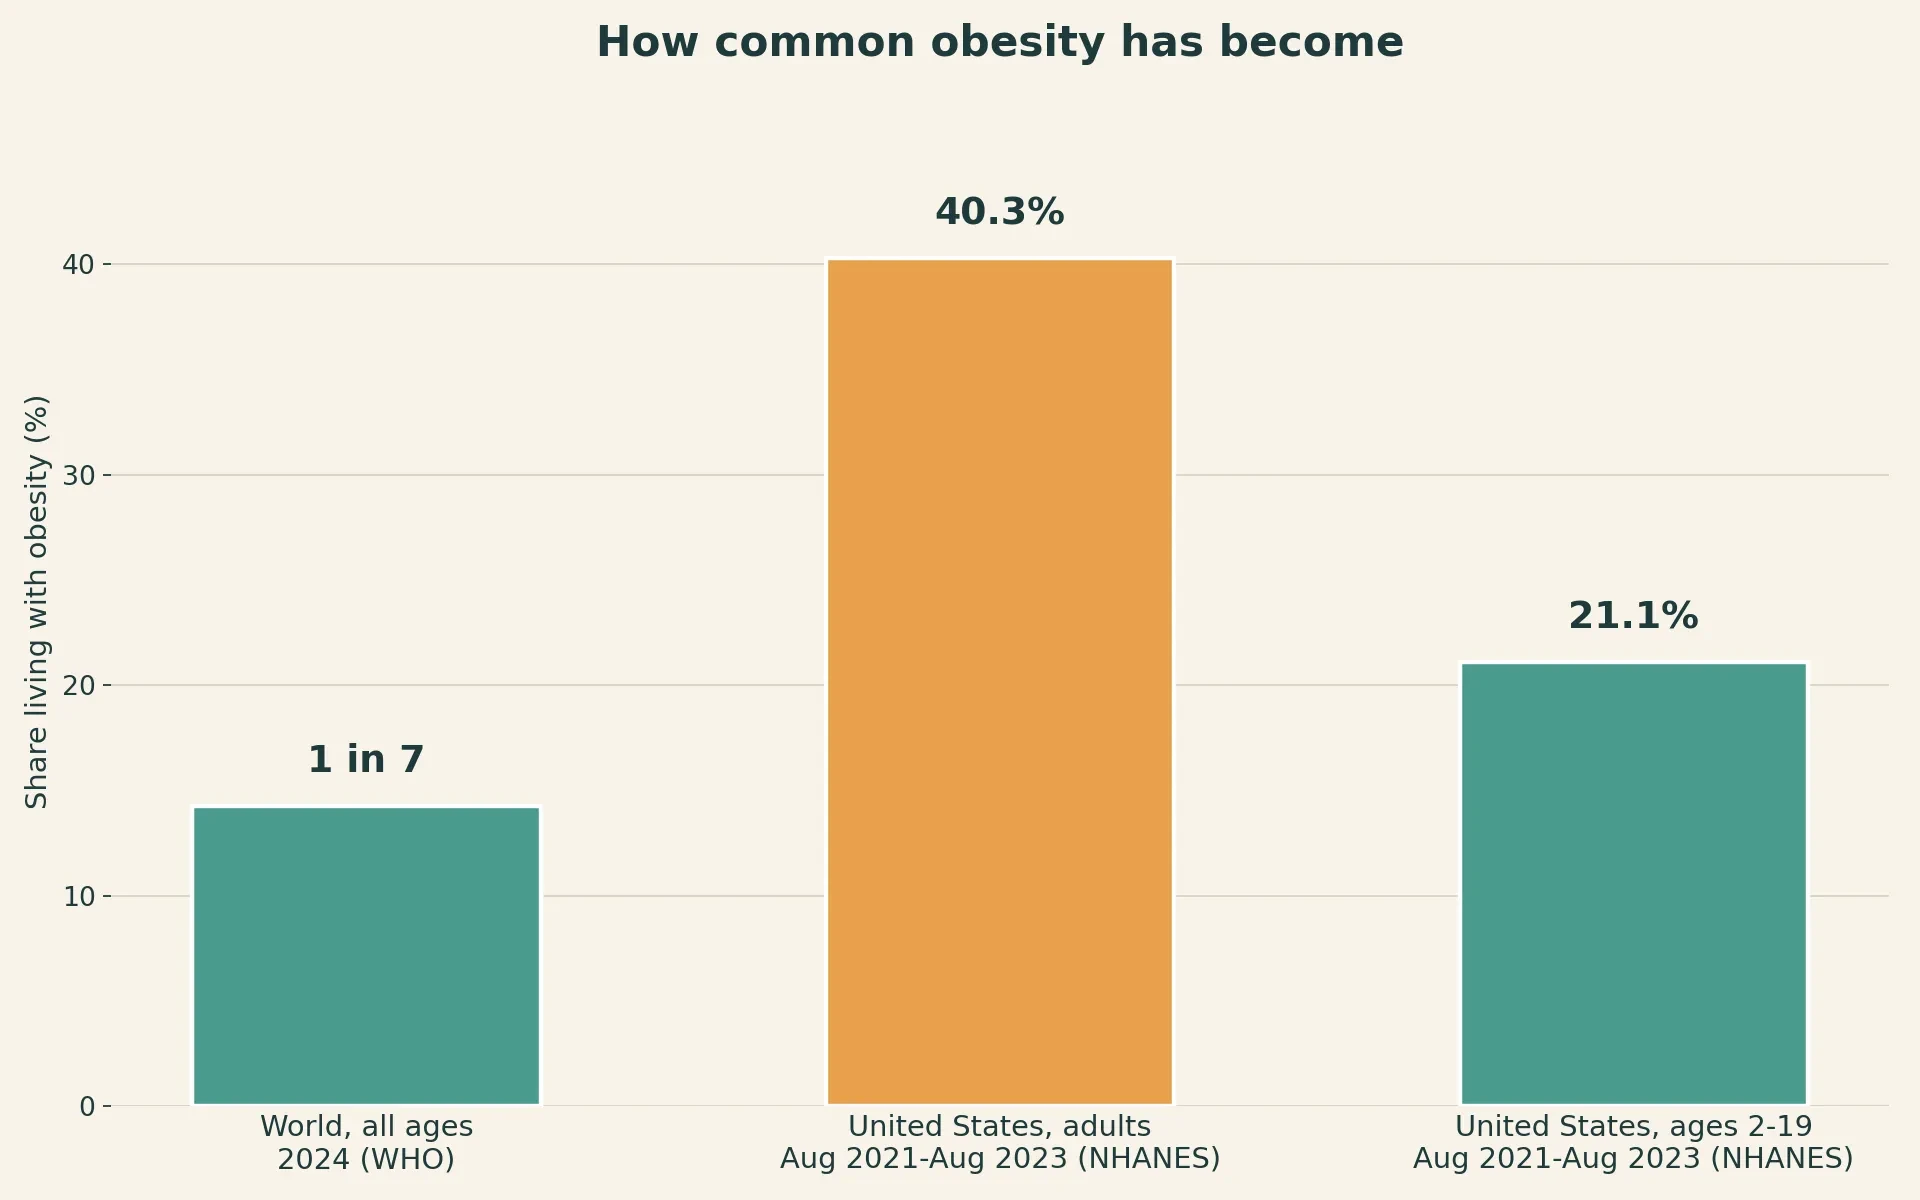
In 2024, one person in seven in the world — 1.1 billion people — was living with obesity. That is the latest figure from the World Health Organization, and it is worth pausing on: not one in eight, as the previous release had it, but one in seven, on the newest data. The same release puts the wider picture in stark terms. Forty-five percent of adults aged eighteen and over — 2.6 billion people — were overweight in 2024, and of those, 940 million were living with obesity, or sixteen percent of all adults. Forty-four percent of men and forty-five percent of women were overweight.
Children are part of the same picture. In 2024, four hundred million children and adolescents aged five to nineteen were overweight, including 170 million living with obesity. Overweight in that age group, including obesity, rose from eight percent in 1990 to twenty percent in 2024 — nineteen percent of girls and twenty-one percent of boys — while obesity itself rose from two percent, or 31 million children, in 1990 to eight percent, or 170 million, in 2024. Among children under five, an estimated 35 million were overweight in 2024; almost half of them lived in Asia, and the number in Africa has increased by nearly twelve percent since 2000.
Group (WHO, 2024) | Overweight | Living with obesity |
|---|---|---|
Adults aged 18 and over | 45% — 2.6 billion people | 16% — 940 million people |
Children and adolescents aged 5–19 | 400 million (including obesity) | 8% — 170 million |
Children under 5 | 35 million | Not reported separately |
All people worldwide | — | 1 in 7 — 1.1 billion people |
Table 2: The WHO's 2024 global figures for overweight and obesity. The figures rest on the NCD Risk Factor Collaboration's analysis published in Nature in 2026.
2.2 The trend: adult obesity more than doubled since 1990; adolescent obesity quadrupled
The 2024 figures are not a snapshot of a stable situation. They are the latest point on a steep curve. Worldwide adult obesity has more than doubled since 1990, and adolescent obesity has quadrupled. Adult overweight rose from twenty-five percent in 1990 to forty-five percent in 2024. That is a change measured in a single generation — far too fast for genes to explain, since the human genome does not rewrite itself in thirty years. Something in the environment changed, and the biology followed.
Where it is rising fastest has also changed. Overweight prevalence in adults varied by WHO region in 2024, from thirty-two percent in the South-East Asia and African regions to sixty-eight percent in the Region of the Americas. But obesity prevalence is now increasing faster in low- and middle-income countries and in rural populations than in the high-income countries it was once associated with. Obesity is no longer, if it ever was, a condition of affluence. It is increasingly a condition of food systems that make energy-dense, heavily processed food cheap and everywhere, while healthy food, safe places to move, and time to cook become harder to reach.
2.3 The United States: 40.3% of adults, 21.1% of children — the latest NHANES
The most recent American figures come from the National Health and Nutrition Examination Survey, and they are measured, not self-reported — trained examiners weighed and measured the participants, which matters, because people tend to under-report their weight and over-report their height. In August 2021 to August 2023, 40.3 percent of American adults aged twenty and over had obesity, and 9.7 percent had severe obesity (age-adjusted), while 31.7 percent were overweight. The figures break down to 39.2 percent of men and 41.3 percent of women with obesity in crude terms.
The age pattern is telling. Obesity prevalence was highest at ages forty to fifty-nine, at 46.4 percent, compared with 35.5 percent at ages twenty to thirty-nine and 38.9 percent at sixty and over. Severe obesity followed the same shape: 12.0 percent at ages forty to fifty-nine, 9.5 percent at twenty to thirty-nine, and 6.6 percent at sixty and over — and severe obesity was nearly twice as common in women as in men, 12.1 percent against 6.7 percent in crude terms. The long view is starker still. Age-adjusted adult obesity rose from 22.9 percent in 1988–1994 to 40.3 percent in August 2021 to August 2023, and severe obesity from 2.8 percent to 9.7 percent over the same span. From 2013–2014 through August 2021 to August 2023, overall obesity prevalence did not change significantly — but severe obesity kept increasing.
Children and teenagers tell the same story at higher speed. In that same survey round, an estimated 21.1 percent of American children and adolescents aged two to nineteen had obesity, including 7.0 percent with severe obesity, and 15.1 percent were overweight — the highest rate ever recorded in the survey's history. Obesity in this age group rose from 5.2 percent in 1971–1974, and 13.9 percent in 1999–2000, to 21.1 percent. Severe obesity rose from 1.0 percent to 7.0 percent over the same long span.
For scale, the Healthy People 2030 goals — the United States' own public-health targets — aim for adult obesity prevalence of 36.0 percent and 15.5 percent in children and adolescents. The country is above both, and the children's figure is above the target by nearly six percentage points.
2.4 What obesity costs: 3.7 million deaths in 2023 attributed to higher-than-optimal BMI
In 2023, higher-than-optimal BMI caused an estimated 3.7 million deaths, by increasing deaths from cardiovascular diseases, diabetes and cancers, according to the Global Burden of Disease study cited by the WHO. That is a modelled estimate, not a count of death certificates, and it should be read as one: it attributes deaths to a risk factor through statistical modelling, which carries uncertainty. But the order of magnitude is the point. Obesity is not a cosmetic issue and not a niche concern. It sits behind a substantial share of the world's most common causes of death.
The economic projections run in the same direction, and they too must be labelled as projections rather than measurements. If nothing is done, the global costs of overweight and obesity are predicted to reach three trillion dollars a year by 2030 and more than eighteen trillion dollars by 2060, according to the World Obesity Federation's analysis cited by the WHO. Those are forecasts, and forecasts can be wrong. What they capture is the direction of travel: a condition affecting one person in seven, with costs compounding through diabetes, heart disease and cancer, does not stay cheap.
2.5 What obesity raises the risk of: type 2 diabetes, heart disease, stroke, 13 cancers
Compared with people of healthy weight, people with overweight or obesity are at greater risk of diabetes, high blood pressure, cardiovascular disease and stroke, as well as at least thirteen types of cancer and an elevated risk of death from all causes, according to the US National Cancer Institute. The cancer list, drawn from a review of more than a thousand cohort studies by the International Agency for Research on Cancer, is specific:
Endometrial cancer — the strongest link of all; for type 1 endometrial cancers, people with severe obesity have about seven times the risk of people of healthy weight, and people with overweight or obesity two to four times the risk
Oesophageal cancer — also among the highest risk increases
Upper stomach cancer (gastric cardia)
Liver cancer
Kidney cancer
Multiple myeloma
Meningioma
Pancreatic cancer
Colorectal cancer
Gallbladder cancer
Postmenopausal breast cancer
Ovarian cancer
Thyroid cancer
The proposed mechanisms linking obesity to cancer include higher blood levels of insulin and insulin-like growth factor-1, driven by insulin resistance, along with chronic inflammation and altered sex hormones. None of this means that any individual person with obesity will develop cancer — most will not — but at the level of populations, the pattern is consistent and large. The same is true of type 2 diabetes and heart disease, where the links are among the strongest in medicine, and where the biology runs through insulin resistance and the fat that gathers around the organs. The mechanisms behind those links are the subject of the next three sections, starting with the hormone that first showed scientists that fat tissue talks to the brain.
3. Leptin: The Hormone That Tells the Brain How Much Fat You Have
3.1 The mice that could not stop eating: Coleman, parabiosis, and the missing "satiety factor"
The story of leptin begins with mice that could not stop eating. In 1950, researchers at The Jackson Laboratory in Maine noticed a strain of mice that grew enormously fat and diabetic. They called the strain obese, shortened to ob, and for decades nobody knew what was wrong with it. The mice ate far more than normal mice, moved less, and stored fat relentlessly. Something in their biology was missing — or something was failing to arrive where it was needed.
In the 1970s, a geneticist named Douglas Coleman, working at the same laboratory, devised an experiment that sounds like gothic fiction and turned out to be one of the most elegant in the history of physiology. He surgically joined pairs of mice together — a technique called parabiosis — so that they shared a single blood supply, and watched what happened. When an ob/ob mouse, which lacked something, was joined to a normal mouse, the ob/ob mouse stopped overeating and lost weight. The normal mouse's blood was supplying a factor the ob/ob mouse could not make: a circulating "satiety factor" that told the brain to stop eating.
Then Coleman tried a second strain, the db/db mouse, which was just as fat and just as hungry. When a db/db mouse was joined to a normal mouse, the normal mouse starved. The db/db mouse, Coleman reasoned, was making the factor in abundance but could not respond to it — it was resistant — and its blood, flooded with the signal, shut down the normal partner's appetite entirely. The db/db mouse's brain, he predicted, was where the factor acted: the hypothalamus, the small region at the base of the brain that would turn out to be the seat of appetite control. Coleman had no molecule in hand, only a pattern in blood. He had to wait two decades for someone to find it.
3.2 1994: Friedman clones the ob gene and finds leptin
The wait ended in December 1994, when Jeffrey M. Friedman and colleagues at Rockefeller University published the positional cloning of the mouse ob gene and its human counterpart in Nature. The search had taken eight years. The gene encoded a protein hormone of 16 kilodaltons, produced predominantly by white fat tissue, that the team named leptin — from the Greek leptos, meaning "thin". When I first learned that, I laughed out loud: the hormone that reports how much fat you have is named after thinness. It is a fitting name, though, for a signal whose job is to keep you thin — or at least, to keep you from getting fatter.
The original paper described the ob gene transcript as 4.5 kilobases long, expressed exclusively in fat tissue, and predicted to encode a secreted peptide of 167 amino acids. That was the molecular identity of Coleman's satiety factor. The ob/ob mouse could not make it. The db/db mouse could not hear it — its receptor was broken. And the hypothalamus was, as Coleman had predicted, the main target: leptin was considerably more potent when injected directly into the central nervous system than into the bloodstream, pointing to the brain as its primary site of action. Within a year, giving recombinant leptin to ob/ob mice dramatically corrected their obesity and overeating, confirming that the missing molecule was the missing brake.
3.3 What leptin does: made by fat, proportional to fat mass, signals the brain
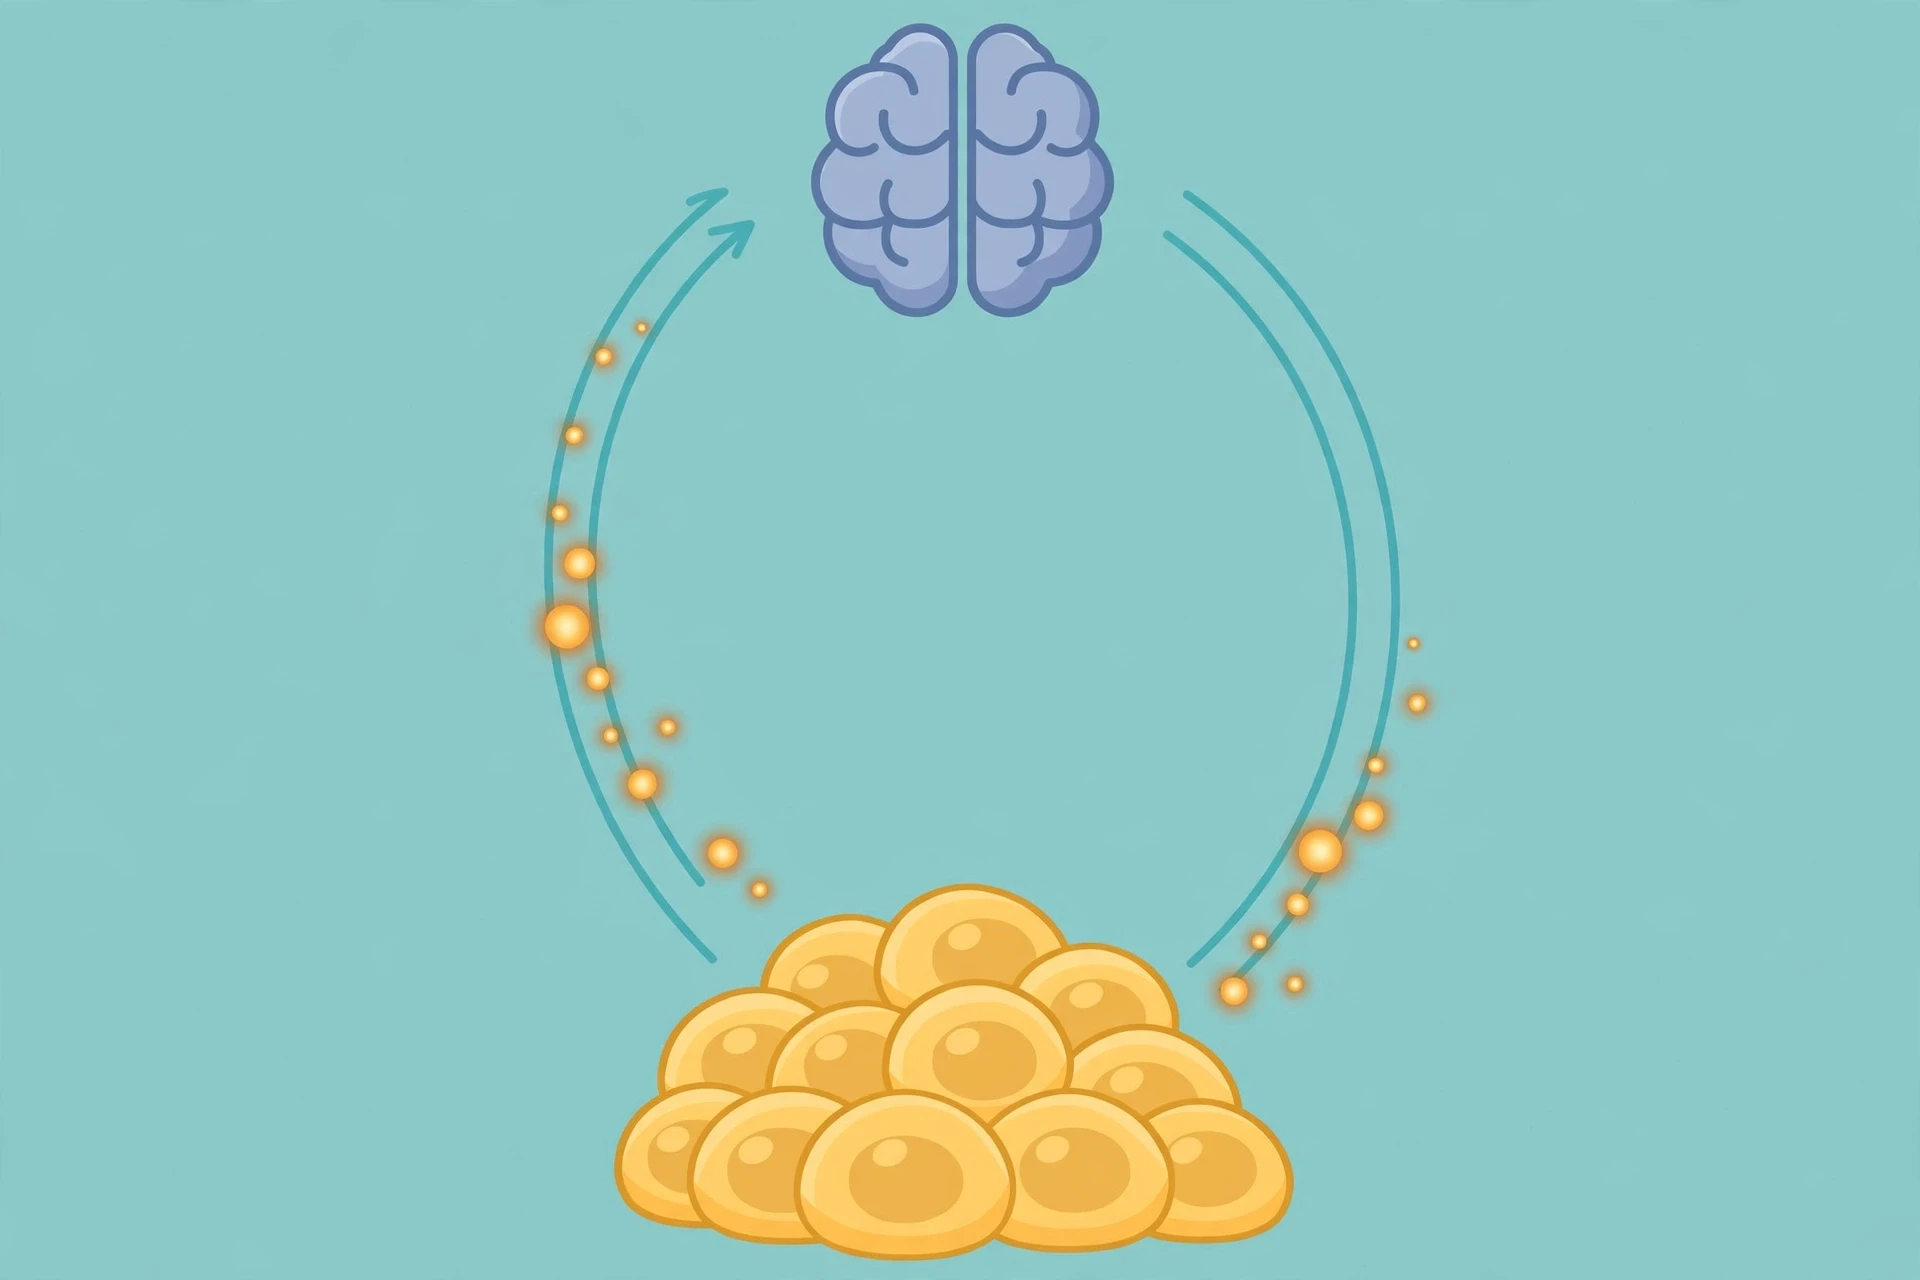
Leptin is, in effect, a fuel gauge. Fat cells make it and release it into the blood in rough proportion to how much fat the body carries: more fat, more leptin; less fat, less leptin. The brain reads the level and adjusts appetite and energy expenditure accordingly. When fat stores fall, leptin falls, and the brain responds as though the body were running low on fuel: hunger rises, the drive to eat strengthens, and energy expenditure eases down. When fat stores rise, leptin rises, and the brain applies the brake.
That much is the textbook picture, and it is broadly right. But two details in it matter for everything that follows. The first is that leptin is secreted in a pulsatile, partly circadian pattern — rising overnight and after meals, falling with fasting and with weight loss. The second is that leptin governs long-term energy balance over weeks and months, not fullness after a single meal. It is a gauge of the fuel tank, not a sensor for the last bite. People sometimes describe leptin as a "satiety hormone" that makes you feel full after eating, and that framing misleads: the meal-to-meal signals belong mostly to the gut, which is the subject of the next section. Leptin answers a slower question — how much energy is stored — and it answers it continuously.
Leptin deficiency in ob/ob mice causes morbid obesity, diabetes and neuroendocrine abnormalities, and leptin replacement decreases food intake, normalises glucose control and increases energy expenditure in those mice. The logic is clean in the mouse. In humans, as the next section shows, the cleanest version of the story is also the rarest.
3.4 The proof in humans: children born without leptin
The decisive human evidence arrived in 1997, three years after the gene was cloned. Two severely obese cousins of Pakistani origin living in the United Kingdom, both with very low serum leptin despite markedly elevated fat mass, were found to carry the same homozygous frameshift mutation — a deletion of a single guanine nucleotide in codon 133 of the LEP gene. They were, in human form, the ob/ob mouse: children whose fat tissue could not make leptin at all, and whose hunger was therefore constant and overwhelming from the first months of life. The paper, by Montague and colleagues in Nature, provided the first genetic evidence that leptin is an important regulator of energy balance in humans.
What happened next is the most persuasive demonstration in the field. When children born without leptin were given recombinant leptin replacement, their appetite eased, their fat mass fell, and the high insulin and abnormal blood lipids that came with their condition improved — with benefits sustained over years of treatment (Farooqi and colleagues, 2002; Gibson and colleagues, 2004, who followed one child through four years of leptin therapy). The hormone that the mice were missing turned out to be the hormone these children were missing, and replacing it worked.
That is why leptin deficiency matters so much — and why it matters so little to most people with obesity. Congenital leptin deficiency is extremely rare: only around 150 cases have been described in the medical literature. It proves that leptin is necessary for normal appetite control. It does not prove that most obesity is caused by a lack of leptin. In fact, the opposite is true, and that opposite is the subject of section 6. Most people living with obesity have high leptin, not low leptin, because they have more fat tissue making it. Their problem is not a missing signal. It is a signal the brain no longer seems to hear.
3.5 Why leptin is a long-term signal, not a meal-to-meal fullness signal
It is worth pausing on the distinction, because it clears up a common confusion. Leptin rises overnight and after meals and falls with fasting and weight loss — but its job is to report the state of the fuel tank over weeks, not to announce the end of lunch. The hormones that track individual meals are made in the gut, rise and fall within minutes to hours, and act quickly. Leptin moves slowly, and the brain treats it as background information about energy stores.
That slowness is also why leptin is a poor target for quick fixes, a point section 6 takes up in detail. A hormone that reports fat mass cannot be expected to change behaviour meal by meal, and adding more of it to a system that already has plenty of it does not add information. The brain already knows the tank is full. The question is why it does not act on what it knows — and that question leads directly to the gut, whose signals are faster, louder, and far more immediate.
Leptin is one of several hormones that coordinate appetite, and the endocrine system as a whole works the same way: glands and tissues releasing chemical messages that travel in the blood and change what distant organs do. Our companion article on how the endocrine system works explains that messaging system in full, including how feedback loops keep hormone levels within bounds — and what happens when the loop itself starts to fail.
4. Ghrelin: The Hunger Hormone — and the Rest of the Gut's Signals
4.1 What is ghrelin? The 1999 discovery
If leptin is the fuel gauge, ghrelin is the alarm clock. It was identified in 1999 by Masayasu Kojima and colleagues, who were not looking for a hunger hormone at all. They were hunting for the natural ligand of a receptor in the pituitary gland — the growth-hormone secretagogue receptor — a receptor whose natural partner was unknown. Purifying extracts from rat stomachs, they found a 28-amino-acid peptide with an unusual fatty-acid modification, which they named ghrelin: the name comes from its role as a growth-hormone-releasing peptide, from the Proto-Indo-European root ghre-, "to grow". The paper appeared in Nature in December 1999, five years to the month after leptin's debut in the same journal.
The discovery was a surprise in two ways. First, the molecule came from the stomach, not the brain — the gut was making a hormone that acted on the brain. Second, ghrelin turned out to be the only known appetite-stimulating hormone produced by the gut. Almost everything else the gut releases after a meal tells the brain to stop. Ghrelin tells it to start.
4.2 Where it is made and how it behaves around meals
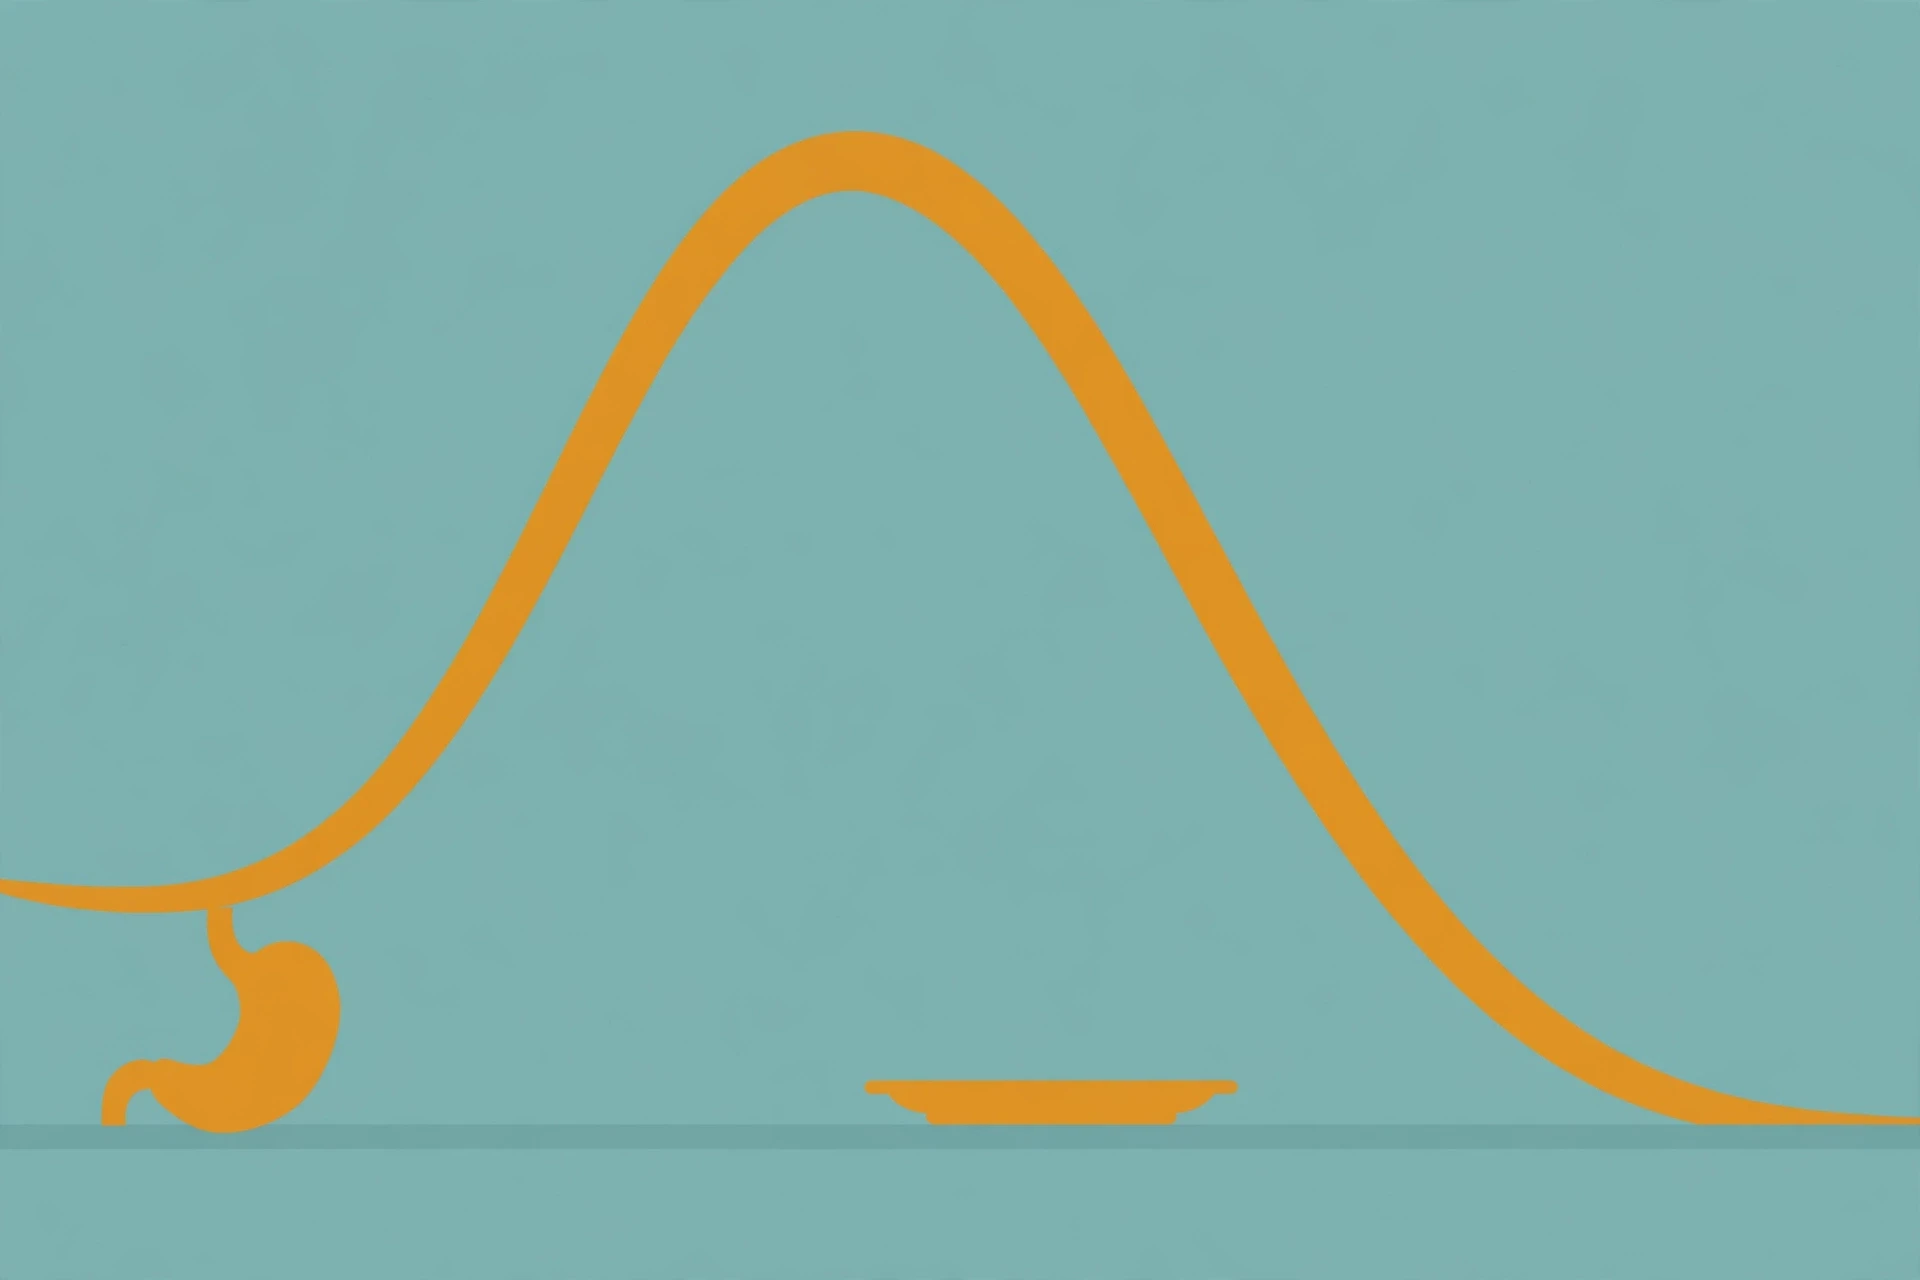
Ghrelin is produced mainly by enteroendocrine cells — the X/A-like, or P/D1, cells — of the stomach fundus, the upper part of the stomach, with smaller amounts coming from the small intestine, the pancreas, the hypothalamus and the pituitary. Its behaviour around meals is strikingly regular. Blood ghrelin rises progressively in the hour or two before a meal, peaks around the time eating would normally begin, and falls within about an hour after eating. Give ghrelin to an animal or a person, centrally or into the bloodstream, and food intake rises — it is the most potent appetite-stimulating peptide the body makes.
That pattern is why ghrelin is often called the "hunger hormone", and the label is roughly fair, with one caveat: ghrelin tracks the timing of meals more than the amount of energy in the body. It is a short-term signal, rising before meals and falling after them, where leptin is a long-term signal that moves over weeks. The two hormones answer different questions, on different timescales, and the brain listens to both.
Hormone | Where it is made | When it rises | What it tells the brain |
|---|---|---|---|
Leptin | Fat tissue | With fat mass, over weeks; higher overnight | Energy stores are ample — ease off eating, spend energy |
Ghrelin | Stomach (mainly) | Before meals; falls after eating | It is time to eat — start now |
Peptide YY (PYY) | Gut, after meals | After eating, in proportion to calories | Enough for now — reduce appetite |
Cholecystokinin (CCK) | Small intestine | During and just after meals | Food is arriving — slow down and stop |
GLP-1 | Gut, after eating | After meals | Slow stomach emptying, reduce appetite |
Insulin | Pancreas | After eating, with blood sugar | Complex effects on appetite circuits; inconsistent between studies |
Table 3: The appetite hormones at a glance. Leptin reports long-term energy stores; the gut hormones track individual meals. Exact PYY figures from early infusion studies are not quoted here because they rest on a single secondary summary.
4.3 How ghrelin reaches the brain and switches hunger on
Ghrelin acts on its receptor, GHSR1a, in the hypothalamic arcuate nucleus — the same small region where leptin acts — and on the anterior pituitary, where it releases growth hormone. In the arcuate nucleus it excites the hunger-promoting NPY neurons, the very cells that leptin suppresses, and it suppresses the fullness-promoting POMC neurons that leptin excites. The two hormones pull the same circuit in opposite directions, which is exactly what a well-designed control system looks like: one signal for "stores are low, eat", one for "stores are ample, stop", converging on the same neurons.
In animal studies of meal patterns, ghrelin's main effect was to shorten the time until the next meal — producing one extra eating episode soon after it was given — rather than to make each meal enormous. It also stimulates stomach movement and acid secretion in anticipation of a meal, preparing the gut for food that has not yet arrived. The picture is of a hormone that organises the start of eating: it gets the animal to the food, quickly, and gets the stomach ready. All of this is animal evidence, and it should be labelled as such — but the human pattern of ghrelin rising before meals and falling after them matches it closely.
4.4 Ghrelin is more than hunger: reward, sleep, memory
Ghrelin does more than start meals. Its receptor appears in brain regions involved in reward, learning and memory, sleep–wake regulation, taste and glucose metabolism, and the hormone participates in those systems too — though the evidence there is thinner and more scattered than the feeding evidence, and this article will not overclaim it. The point worth keeping is that a molecule first found as a growth-hormone signal, then recognised as a hunger signal, turns out to be woven into several brain functions at once. Appetite is not an isolated circuit. It shares machinery with reward, with sleep, and with the way the brain values food — which is one reason appetite is so hard to override by conscious effort alone. You are not arguing with a single switch. You are arguing with a network.
4.5 Why "leptin vs ghrelin" is the wrong framing: one long-term gauge, one meal-timing alarm
Popular writing loves a duel — leptin versus ghrelin, fullness versus hunger, good hormone versus bad hormone. The framing is neat and mostly wrong. Leptin and ghrelin are not opponents. They are two instruments measuring different things on different timescales: one reports how much energy is stored, the other reports when the next meal is due. The brain needs both pieces of information, and it integrates them with a dozen other signals in the hypothalamus.
That integration is where the real action is. A gauge is only useful if something reads it, and the reader is a small cluster of neurons at the base of the brain. The next section opens that control room and looks at the wiring.
5. The Hypothalamus: The Brain's Appetite Control Room
5.1 An almond-sized region with an outsized job: the old lesion experiments
The hypothalamus is a small region at the base of the brain, roughly the size of an almond, sitting just above the brainstem and below the thalamus. It controls body temperature, thirst, sleep, stress hormones and reproduction — and, as a series of experiments in the 1940s first showed, appetite. Hetherington and Ranson, lesioning precise spots in the brains of rats, found that destroying the ventromedial hypothalamus produced animals that ate relentlessly and grew enormously fat, while destroying the lateral hypothalamic area produced animals that stopped eating altogether. The crude map that came out of those experiments — a "satiety centre" in the middle, a "hunger centre" on the side — was too simple, and modern neuroscience has replaced it with something far more detailed. But the core finding has survived eighty years of refinement: damage this small region and appetite regulation falls apart. The hypothalamus is where the signals converge and where the decisions get made.
5.2 The arcuate nucleus: two tribes of neurons
Within the hypothalamus, the most important structure for appetite is the arcuate nucleus, a small cluster of neurons sitting near the base of the third ventricle, close to blood vessels whose walls are unusually leaky. That leakiness is a feature, not a flaw: it lets hormones circulating in the blood — leptin, ghrelin, insulin — reach these neurons more easily than they can reach most of the brain.
The arcuate nucleus contains two populations of neurons with opposite effects on feeding. The first, the POMC/CART neurons, are the fullness tribe. They release a molecule called alpha-melanocyte-stimulating hormone, or alpha-MSH, which acts on melanocortin-4 receptors — MC4R — mainly in a neighbouring region called the paraventricular nucleus, to suppress appetite. Switch these neurons on and animals eat less. The second, the NPY/AgRP neurons, are the hunger tribe. They release neuropeptide Y and agouti-related peptide, or AgRP. AgRP is an inverse agonist at the same melanocortin receptors — it does not merely block alpha-MSH, it actively pushes the receptor in the opposite direction, toward hunger, even when alpha-MSH is absent. And the hunger neurons also release GABA, a fast inhibitory transmitter, which directly quiets the fullness neurons. The two tribes do not merely disagree. They actively suppress each other.
The balance between them is the output. When the hunger neurons are quiet and the fullness neurons are active, appetite falls. When the hunger neurons fire and the fullness neurons are silenced, appetite surges. Everything else in this article — leptin, ghrelin, genes, sleep, stress, medicines — acts, in the end, by tilting this balance one way or the other.

5.3 How leptin, ghrelin and insulin talk to those neurons
Leptin excites the POMC fullness neurons and inhibits the NPY/AgRP hunger neurons. Ghrelin does the opposite: it excites the hunger neurons and suppresses the fullness neurons. Insulin, the pancreatic hormone, also acts on these neurons, but its effects are inconsistent between studies — sometimes it looks like a satiety signal, sometimes it does not — and this article will not pretend the picture is tidier than it is. The leptin and ghrelin directions, by contrast, are consistent across studies and are the backbone of the circuit.
Other gut signals feed in as well. Peptide YY, released by the gut after meals in proportion to calories, acts on Y2 receptors on the hunger neurons to quiet them. Cholecystokinin, released during meals, contributes to the short-term stop signal. The arcuate nucleus is not a leptin-and-ghrelin duet. It is a switchboard, and the hormones are the callers.
One detail illustrates how much rides on a very small number of cells. In mice, activating as few as about 800 AgRP neurons — a tiny cluster — triggers voracious feeding within minutes, even in animals that have just eaten, and the animals need no training to do it (Aponte, Atasoy and Sternson, Nature Neuroscience, 2011). Removing those neurons in adult mice causes acute loss of appetite (Gropp and colleagues, Nature Neuroscience, 2005). The hunger tribe is both necessary and sufficient for feeding in these experiments: switch it on and the animal eats; take it away and the animal stops. Eight hundred neurons, in a brain of tens of millions, can override a full stomach. That is the scale of the circuitry that conscious willpower is up against — and it is worth remembering the next time anyone suggests that appetite is a matter of trying harder.
5.4 What happens when the circuit breaks: POMC knockout mice; human MC4R mutations
Break the circuit and the consequences are immediate. Mice engineered to lack POMC — the gene that makes the fullness signal — overeat and become obese, demonstrating that the POMC pathway is genuinely necessary for appetite control. In humans, mutations in MC4R, the receptor that alpha-MSH acts on, are the most common known single-gene cause of obesity, and they sit in the same pathway: the leptin–melanocortin pathway, whose genes include LEP, LEPR, MC4R, POMC and PCSK1. When the receptor that is supposed to receive the "stop" signal is broken, the stop signal never arrives, and appetite runs unchecked from early childhood. Section 8 returns to these genes in detail. The point here is architectural: the circuit is not a metaphor. It is a chain of molecules, and a break at any link in the chain produces the same outcome — relentless hunger.
There is a subtlety worth noting, because it shows how careful the science has to be. Deleting leptin receptors specifically in POMC neurons does not increase food intake in mice, which suggests that leptin's appetite effects are also mediated by receptors elsewhere in the brain, not only through the POMC cells. The circuit is real, but it is not a single straight line. Leptin talks to many brain regions at once, and the arcuate nucleus is the loudest voice in the conversation, not the only one.
5.5 Beyond the hypothalamus: reward circuits, stress, and why appetite is not a single switch
The hypothalamus is necessary, but it is not the whole story. Appetite also runs through the brain's reward circuits — the same regions that respond to food's taste, smell and pleasure, and that learn to seek out foods that delivered reward before. It runs through stress circuits, which change what people want to eat and how much. It runs through sleep, memory and habit. A person does not eat only because the arcuate nucleus says so; they eat because food is available, because it smells good, because they are tired, because they are celebrating, because it is three in the afternoon and that is when they always eat.
That is why the control-room metaphor needs a qualifier. The hypothalamus is the control room for the homeostatic side of appetite — the side that tracks energy stores and defends body weight. But appetite has a second side, the hedonic side, which tracks pleasure and opportunity, and the two sides negotiate constantly. The homeostatic side can be overruled by a sufficiently rewarding environment, which is why a person can feel full and still eat dessert. And the hedonic side can be amplified by the homeostatic side: when leptin falls after weight loss, food does not merely become more necessary, it becomes more rewarding. The next sections follow both sides of that negotiation — first the idea that the brain stops hearing leptin at all, then the arithmetic of energy balance, then the genes and the environment that set the terms.
6. What Is Leptin Resistance?
6.1 The paradox: high leptin, unsuppressed hunger
Here is the paradox that gives this section its name. Most people living with common obesity have high circulating leptin — often very high — because they have more fat tissue producing it. If leptin suppresses appetite, then people with the most leptin should feel the least hungry. They do not. Their appetite is not suppressed in proportion to their leptin level, and their weight does not fall to match the signal. The gauge reads full, and the brain carries on as though the tank were half empty.
The term invented for this pattern is leptin resistance: an attenuated biological response to leptin despite hyperleptinaemia — high leptin in the blood. The idea is borrowed from insulin resistance, where the hormone is present in abundance but the tissues respond poorly. The analogy is useful as a description. It becomes dangerous when it is treated as a diagnosis, because — as the next sections show — leptin resistance is an observation in search of a definition, not a condition a doctor can test for.
6.2 What the evidence actually shows: transport, signalling (JAK2–STAT3/SOCS3), inflammation
The evidence for leptin resistance, as synthesised in a 2025 review in Endocrine Connections, comes from several lines of work, and the proposed mechanisms cluster into a few groups. First, transport: leptin has to cross the blood–brain barrier to reach the hypothalamus, and in obesity that transport appears to be impaired, so less of the circulating hormone reaches its target even though blood levels are high. Second, signalling: inside the neuron, leptin acts through the JAK2–STAT3 pathway, and that pathway can be dampened — notably by overexpression of a protein called SOCS3, which acts as a brake on leptin signalling, and by reduced expression of the leptin receptor itself. Third, inflammation and cellular stress: obesity is associated with low-grade inflammation in the hypothalamus and with endoplasmic-reticulum stress inside neurons, both of which interfere with leptin signalling. Other proposed mechanisms include defective autophagy, increased mTOR activity, and resistance in tissues outside the brain as well.
None of these mechanisms is proven to be the cause in humans. They are plausible, supported by animal work and by pieces of human evidence, and they probably all contribute to some degree in different people. The honest summary is that the brain's response to leptin is blunted in common obesity, that several molecular brakes have been identified, and that researchers still do not know which brake matters most in any given person — or whether the blunting is a cause of weight gain, a consequence of it, or both feeding each other in a loop.
6.3 The honest limits: no definition, no test
This is the part that rarely makes it into popular articles about leptin resistance, and it is the most important part. There is no agreed clinical definition of leptin resistance and no blood test, imaging marker or challenge protocol that can tell whether a given individual is leptin resistant. A 2012 paper from a National Institutes of Health workshop concluded that the field "is limited by a lack of robust, easily quantifiable behavioral or metabolic biomarkers of the hormone's action" — in plain language, researchers cannot measure leptin resistance in a person the way they can measure blood pressure or blood sugar.
That has a practical consequence that matters to readers. If a website, a supplement seller or a social-media post tells you that you have leptin resistance — or offers to test you for it, or to fix it — it is selling something the science cannot yet deliver. Leptin resistance is a useful description of an observation: high leptin without proportional appetite suppression. It is not a diagnosis you can be given, and it is not a condition with a proven treatment aimed at it directly. Anyone who claims otherwise is ahead of the evidence.
6.4 The trial that is always cited — and what it really found
The trial most often cited in discussions of leptin and obesity is Heymsfield and colleagues' 1999 study in JAMA, and it is worth reading carefully, because it is routinely misdescribed. Fifty-four lean adults and seventy-three adults with obesity were randomised, double-blind, to placebo or one of four escalating doses of recombinant leptin, injected under the skin every day for up to twenty-four weeks. Weight loss rose with dose. But the effect was modest and wildly variable: in the highest-dose group of adults with obesity — just eight people — the average weight loss at twenty-four weeks was 7.1 kilograms, with a standard deviation of 8.5 kilograms, meaning some lost a great deal and some lost almost nothing. Most of the weight lost was fat, which is a point in leptin's favour. But the trial did not show that giving leptin to people who already have plenty of it produces reliable, meaningful weight loss. Later placebo-controlled trials found no significant weight loss beyond diet alone — consistent with a 2025 review in Endocrine Connections, which notes that leptin analogues usually fail to produce the expected weight-loss effect in people with overweight or obesity — and injection-site reactions were common.
The trial's real lesson is the contrast it sets up. Leptin works dramatically when it is genuinely missing. It works poorly and unpredictably when it is already abundant. That contrast — not the 7.1-kilogram figure on its own — is the core evidence for leptin resistance.
6.5 Why leptin works in deficiency and fails in common obesity
Put the two situations side by side and the pattern is stark. In congenital leptin deficiency, the signal is absent, the brain is starved of information, and replacing the hormone restores the information: appetite falls, weight falls, metabolism normalises. In lipodystrophy, where fat tissue is missing and leptin is therefore low, the same logic holds — leptin replacement helps. In common obesity, the signal is already loud, and adding more volume does not add information. The brain is not waiting for more leptin. It is, for reasons researchers are still mapping, responding less to the leptin it already has.
That is why the 2025 review's summary is phrased as a contrast: leptin and its analogues "usually fail to produce the expected weight-loss effect in individuals with overweight or obesity, although they remain highly effective in individuals with congenital leptin deficiency and lipodystrophy". The failure is informative. It tells scientists that the bottleneck in common obesity is not the amount of leptin in the blood. It is somewhere downstream — in transport, in the receptor, in the signalling pathway, in the inflamed hypothalamus — and finding that bottleneck is one of the live questions in the field.
6.6 What is not leptin resistance: supplements "for leptin resistance" contain no leptin and have no documented effect
A word of caution belongs here, because the gap between what is known and what is sold is widest exactly here. Products marketed as fixing leptin resistance — powders, capsules, teas, "leptin reset" programmes — contain no leptin. Leptin is a protein hormone; swallowed, it would be digested like any other protein, and it is not available as an over-the-counter supplement in any case. There is no documented evidence that any such product improves leptin signalling in humans, and there is no test that could show whether it had. The honest position is simple: nobody can sell you a fix for a condition that cannot be measured, using a hormone the product does not contain. What can change leptin signalling, over time, is the same set of factors that changes the rest of the system — weight itself, sleep, and the food environment — and those change it slowly, through the biology, not through a capsule.
7. Energy Balance: The Ledger Is Real, the Arithmetic Is Not Simple
7.1 Energy balance as bookkeeping: intake vs expenditure — the physics is not in dispute
Everything in this article rests on a fact that is not in dispute: energy balance is real bookkeeping. The body stores energy it does not use, mostly as fat, and it draws on stored energy when intake falls short of expenditure. That is thermodynamics, and no hormone, gene or environment can repeal it. If a person consistently eats less energy than they expend, they lose weight. If they consistently eat more, they gain. Nothing in the leptin story or the genetics story contradicts that.
But the bookkeeping metaphor misleads if it is read as a claim that the numbers stay still while you change them. The ledger is real. The arithmetic is not simple, because both sides of the ledger move when you touch them. Eat less, and expenditure falls. Lose weight, and the body burns less at rest, moves less spontaneously, and gets hungrier — all of which shrink the deficit you created. Gain weight, and expenditure rises to meet the larger body. The ledger balances itself, and it balances itself in the direction of the weight you already have. That is the whole subject of this section.
7.2 BMR, TDEE and their components
Total daily energy expenditure — TDEE, the energy a person burns in a day — has three main components. The largest is the resting metabolic rate: the energy the body uses to keep itself alive at rest, powering the brain, the liver, the heart, the kidneys and the rest of the machinery. Then there is the energy cost of movement, from walking to the shops to structured exercise, which varies enormously between people and between days. And there is the thermic effect of food, the energy spent digesting and processing what is eaten. Body size matters to all three: a larger body costs more to maintain and more to move, which is why expenditure rises with weight gain and falls with weight loss.
This article will not state a fixed share of TDEE for resting metabolism — the figure often quoted, around sixty to seventy percent, was not verified against a primary source in this session — because the share varies so much with how active a person is that a single number would mislead more than it helps. What matters is the direction of change, not a fixed percentage. Lose tissue, and the machinery that tissue supported needs less fuel. That is the mechanism behind the next three sections, and it is not a malfunction. It is the body doing its job.
7.3 The 3,500-kcal rule: where it came from (Wishnofsky, 1958) and why the prediction fails
The most famous number in weight science is 3,500. It comes from a 1958 calculation by Max Wishnofsky, who estimated that one pound of adipose tissue stores roughly 3,500 kilocalories of energy. The number itself is approximately right. The rule built on it — that a deficit of 3,500 kilocalories produces exactly one pound of weight loss, so a deficit of 500 kilocalories a day produces one pound a week, every week, indefinitely — is wrong, and it was never tested as a prediction of weight loss over time. It rests on two assumptions that break in practice: that all lost weight is fat, and that energy expenditure never adapts.
Both assumptions fail. Early weight loss includes water and lean tissue as well as fat, and the mix changes as loss continues. And expenditure adapts — the resting metabolic rate falls, the energy cost of movement falls because there is less body to move, and appetite rises to push intake back up. The static rule ignores all of that. It draws a straight line; the body bends it.
I once spent an afternoon with a spreadsheet and the 3,500-kcal rule, convinced I had found a neat formula for a friend's weight-loss plan: cut five hundred a day, lose a pound a week, fifty-two pounds in a year. The arithmetic was flawless and the prediction was fiction. Real weight-loss curves bend within weeks, flatten within months, and settle at a plateau far above the straight-line forecast. I had mistaken the energy content of a pound of fat for a law of human behaviour. Wishnofsky made a calculation about tissue. The diet industry turned it into a promise.
7.4 The dynamic view: Hall's model and the "10 kcal/day ≈ 1 lb" rule of thumb
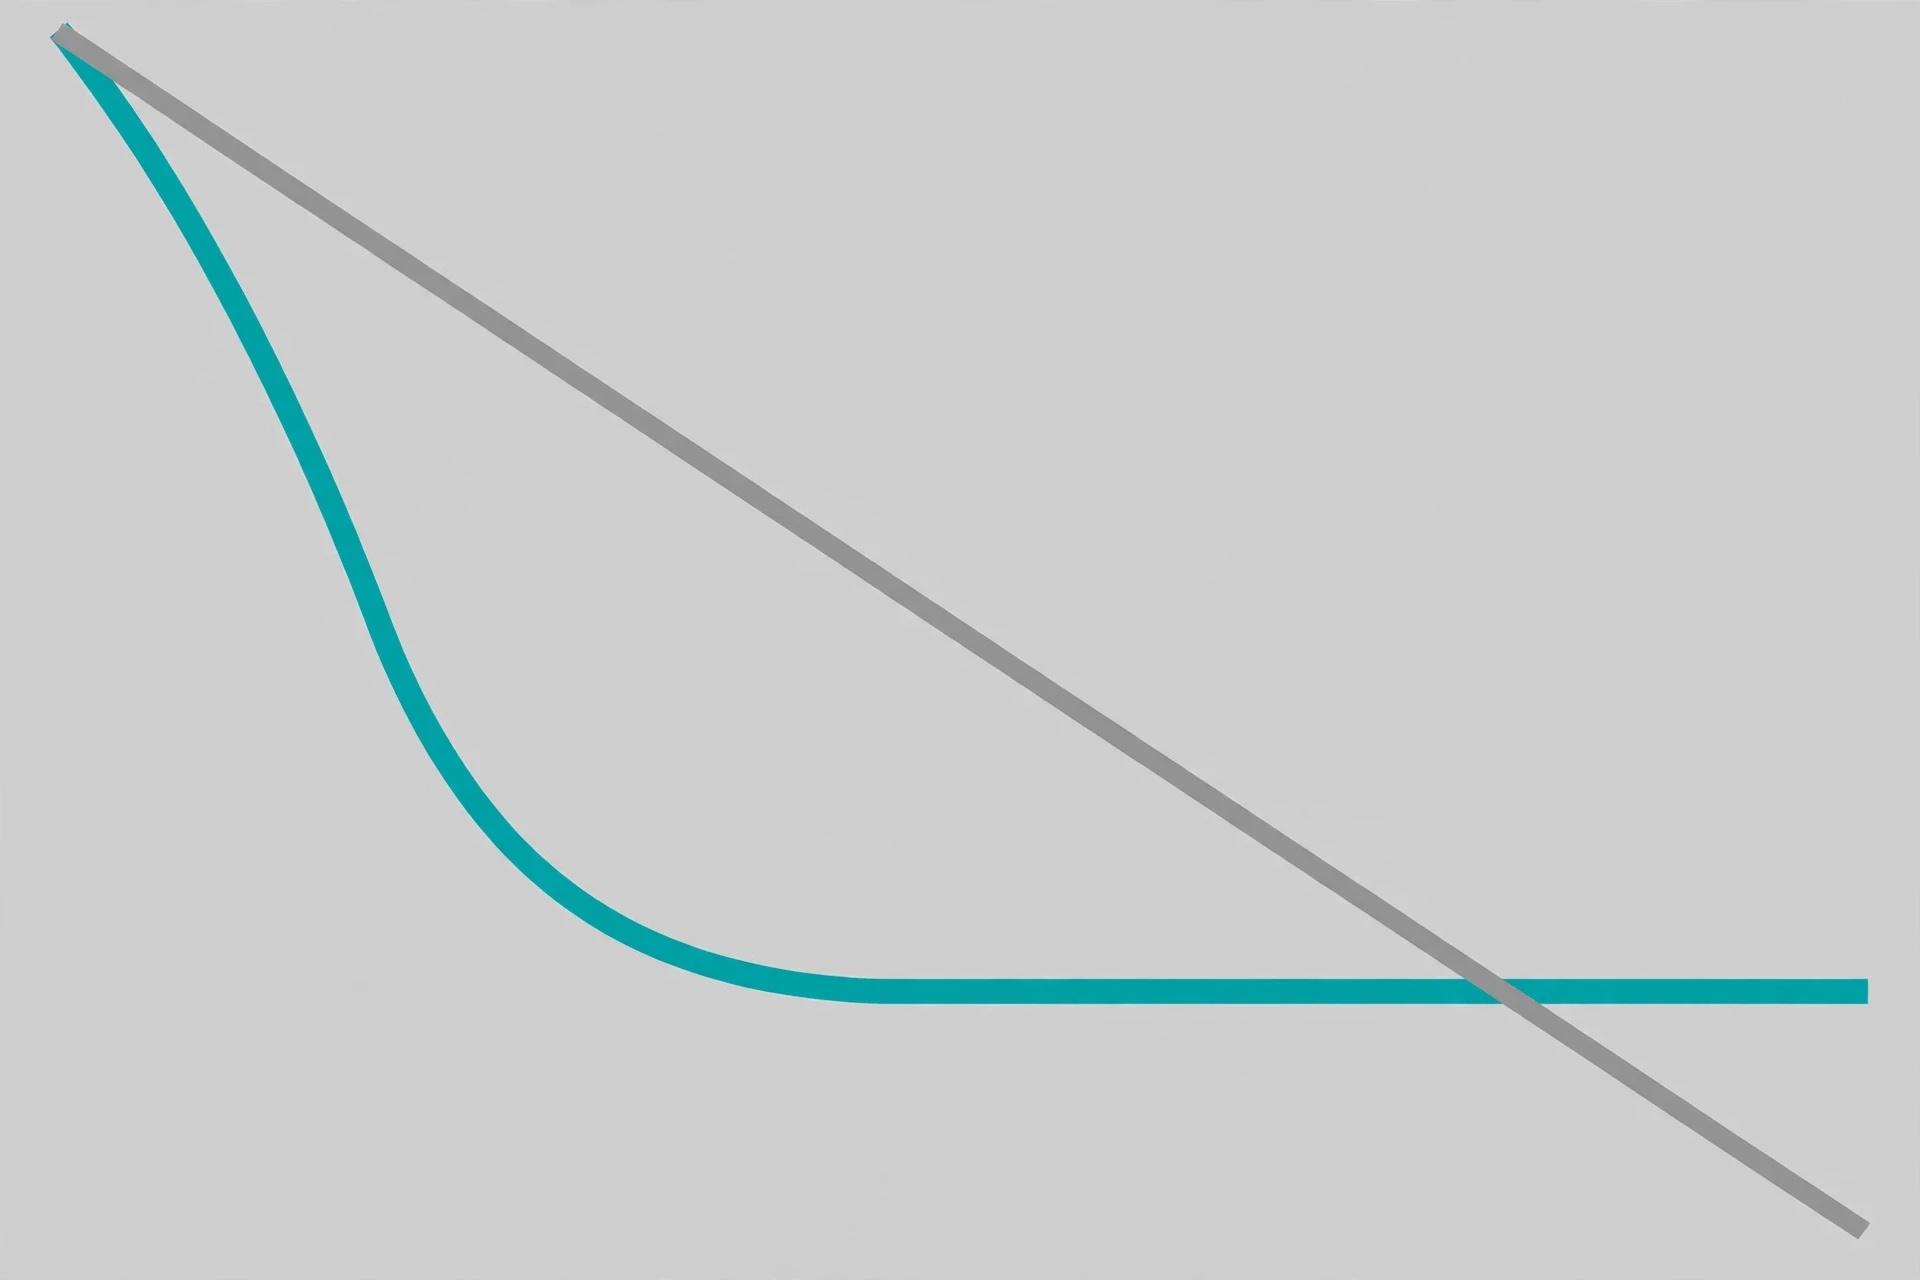
In 2011, Kevin Hall and colleagues at the National Institutes of Health published a dynamic model in The Lancet that replaced the static rule with one that lets body composition and energy expenditure change as weight changes. When they compared the two, the gap was decisive: the 3,500-kcal rule overestimated weight loss by about one hundred percent over three years — it predicted roughly twice the loss the dynamic model showed. The replacement rule of thumb that came out of the model is humbler and far more useful: a permanent change of about ten kilocalories a day eventually moves body weight by about one pound, with about half of that change arriving in the first year and the rest unfolding slowly over the following years.
That rule of thumb reframes what small changes mean. A daily change of a hundred kilocalories — a single sweetened drink, or a daily walk — is worth roughly ten pounds of eventual weight, not fifty-two pounds in a year. It also explains why the early weeks of a diet look so encouraging and the later months look so stubborn: half the total change arrives in the first year, and the curve flattens as the body settles at its new equilibrium. The dynamic model is a model, not a guarantee for any individual — it predicts averages across groups — but it exposes the flaw in the old rule with a clarity no argument can match. A fixed daily change does not produce an endless, linear change in body weight.
7.5 Leibel 1995: the body defends its weight in both directions
The most direct demonstration that the body defends its weight came from an experiment published in the New England Journal of Medicine in 1995. Leibel, Rosenbaum and Hirsch studied eighteen people with obesity and twenty-three who had never had obesity, measuring their energy expenditure at their usual weight and again after they had lost ten to twenty percent of their weight — or, in a separate arm, gained ten percent. Maintaining a weight below the usual weight was associated with a fall in total energy expenditure beyond what the smaller body alone would predict. Maintaining a weight above the usual weight raised expenditure. The authors' conclusion is the durable point, and it is worth quoting in full: "Maintenance of a reduced or elevated body weight is associated with compensatory changes in energy expenditure, which oppose the maintenance of a body weight that is different from the usual weight."
Read that again, because it is the thermostat in action. The body does not merely drift to a new weight and stay there. It spends energy — or saves it — in the direction that pulls weight back toward where it was. Drop weight, and the body burns less, opposing the loss. Gain weight, and the body burns more, opposing the gain. The defence is not symmetrical, as section 10 shows — the pushback against loss is stronger and longer-lasting than the pushback against gain — but the principle is established here, in a controlled experiment with measured food and measured expenditure. The body defends its weight in both directions.
The link to movement is worth making explicit. Physical activity is the most variable part of daily expenditure, and it is also the part most under a person's control — but it, too, is regulated: after weight loss, people tend to move less without noticing, and the energy cost of the same movement falls because there is less body to move. Our companion article on how exercise changes the body follows what activity does to muscle, heart, brain and mood — and why its benefits for health run far beyond the calories it burns.
8. Is Obesity Genetic?
8.1 Heritability: what twin studies actually say — 40–70% of BMI variation
Twin studies consistently show that genetics account for roughly forty to seventy percent of the variation in BMI between individuals. That range comes from reviews of the twin literature, including Loos and Yeo's 2022 synthesis, and it is one of the most replicated findings in the field. But the sentence is easy to misread, and it is misread constantly, so it is worth unpacking with care.
Heritability is a population statistic about variation, not a statement that forty to seventy percent of any one person's weight is "caused by genes". It means that, in the population studied, about half of the differences between people's BMIs can be attributed to differences in their genes rather than differences in their environments. It does not mean that an individual's weight is half-determined. It does not mean genes are destiny. And it varies by population: the percentage of obesity attributable to genetics has been estimated anywhere from six percent to eighty-five percent depending on the population studied, with a typical estimate around fifty percent. Heritability is a property of a population in an environment, not a property of a person.
The most vivid demonstration comes from an experiment that fed people too much on purpose. In 1990, Bouchard and colleagues overfed twelve pairs of young adult male identical twins by one thousand kilocalories a day, six days a week, for eighty-four days — a total surplus of 84,000 kilocalories. The average weight gain was 8.1 kilograms. But the range was enormous: from 4.3 to 13.3 kilograms. And the pattern was unmistakable: twins within a pair gained similar amounts and stored the fat in similar places, while different pairs diverged widely. There was about three times more variance between pairs than within them, and the similarity was strongest for visceral fat, the fat around the organs. The same surplus, the same food, the same eighty-four days — and one pair gained three times as much as another. The authors concluded that genetic factors most likely explained the similarity. The environment supplied the calories. The genes decided what the body did with them.
8.2 FTO: the first obesity gene, and what it does
The first gene robustly associated with obesity in genome-wide association studies was FTO, the fat mass and obesity-associated gene. Its discovery in 2007 opened the modern era of obesity genetics, and what it does is instructive: FTO variants act partly through appetite and energy intake, not through a broken metabolism. People carrying the risk variant tend to eat more — to feel hungrier, to prefer energy-dense foods, to eat past fullness — rather than to burn fewer calories. The precise effect sizes reported for FTO vary between studies and rest on a single secondary summary in this session, so this article will not quote a specific number of kilograms or a fold-change in risk. The direction is what matters: the first obesity gene turned out to be an appetite gene.
That pattern has repeated ever since. The genes that show up in obesity studies are, again and again, genes expressed in the brain — genes involved in appetite, satiety, reward and the hypothalamic circuits of section 5. Obesity genetics is, to a surprising degree, brain genetics.
8.3 MC4R and monogenic obesity: rare, severe, early-onset — and why it matters for everyone else
Monogenic obesity — severe, early-onset obesity caused by a single-gene mutation — is rare but real. The genes involved sit in the leptin–melanocortin pathway: LEP, LEPR, MC4R, POMC and PCSK1. Mutations in MC4R, the receptor that receives the fullness signal alpha-MSH, are the most common known single-gene cause of human obesity. The exact prevalence percentages quoted in secondary summaries vary and were not verified against a primary review in this session, so they are not stated here. What matters is the shape of the condition: it begins in early childhood, it is severe, and it is driven by relentless hunger, not by overeating as a choice.
Why should a rare condition matter to everyone else? Because it reveals the pathway. The same circuit that breaks catastrophically in monogenic obesity is the circuit that operates, more subtly, in all of us. The leptin–melanocortin pathway is the shared machinery of appetite control, and common obesity involves small variations in that machinery — and in the hundreds of other genes that feed into it — rather than a single broken link. Studying the rare, severe cases is how scientists learned which pathway to look at in the common ones.
8.4 Polygenic reality: hundreds of small nudges, not one "obesity gene"
Most obesity, by contrast, is polygenic. Hundreds of genetic variants, each with a small effect, add up to a person's inherited tendency toward higher or lower weight. There is no single "obesity gene" that explains common obesity, and there never was. The search for one was a category error, like searching for a single gene for height. Height is influenced by hundreds of variants, each contributing a millimetre or two, and weight is similar — except that weight, unlike height, is also pushed around by the environment every day.
That is why the genetic story and the environmental story are not rivals. Genes set the sensitivity of the system: how strongly appetite responds to leptin, how quickly fullness arrives, how rewarding a given food feels, how readily fat is stored around the organs. The environment supplies the input the system responds to. A person with a strong inherited appetite drive living in a food environment built around cheap, energy-dense food faces a different challenge from a person with the same genes living where fresh food is cheap and walking is the default. The genes did not change between 1990 and 2024. The environment did — and the genes responded exactly as they were built to.
8.5 Genes load the gun, environment pulls the trigger — and why that sentence, though a cliché, is roughly the right shape
"Genes load the gun, environment pulls the trigger" is a cliché, and like most clichés it survives because it captures something true. It is roughly the right shape for obesity: inherited variation sets how the appetite and metabolism machinery responds, and the modern environment — the subject of the next section — supplies the trigger, daily, at every meal, in every supermarket aisle and every late-night kitchen. The sentence is not a finding. It is a summary, and it should be read as one. The finding underneath it is the twin data, the overfeeding experiment, and the steady accumulation of brain-expressed genes in study after study: the machinery of weight is inherited, and the modern world pushes that machinery in one direction.
9. The Environment That Makes Weight Gain Easy
9.1 Obesogenic environments: what WHO means by the term
The WHO's phrase for the modern food environment is "obesogenic environments" — surroundings that limit access to healthy, affordable food, constrain opportunities for safe physical activity, and are shaped by market forces and inadequate regulation. The definition is deliberately broad, because the forces are broad. It is not only about what is on the supermarket shelf. It is about what the shelf costs, how far away it is, whether there is a safe pavement to walk there, whether the food is marketed to children, whether a person working two jobs has time to cook, and whether the cheapest calories in the shop are also the ones engineered to be hardest to stop eating.
The WHO's framing carries a direct implication: if the environment is a major driver, then the response cannot be individual alone. That is the context for the sentence quoted in section 1 — that obesity is a societal rather than solely an individual responsibility. The environment does not remove personal agency. It sets the price of exercising it. When the easy choice and the healthy choice point in opposite directions at every meal, willpower is being taxed hundreds of times a day, and a tax that heavy eventually collects.
9.2 Ultra-processed food: the NIH metabolic-ward experiment
The clearest experimental evidence that the food environment itself drives overeating comes from the metabolic-ward study that opened this article. Twenty weight-stable adults lived in the NIH Clinical Center for twenty-eight days in a randomised crossover: two weeks on an ultra-processed diet, two weeks on an unprocessed diet, in random order. The diets were matched for the calories presented, and for sugar, fat, sodium, fibre and macronutrients. The volunteers could eat as much or as little as they liked.
On the ultra-processed diet they ate 508 more kilocalories a day than on the unprocessed diet — a difference of roughly a fifth of a typical day's intake, appearing spontaneously, in people who were not trying to overeat. They gained 0.9 kilograms in two weeks on the ultra-processed diet and lost 0.9 kilograms on the unprocessed diet. The effect was not subtle, and it was not a matter of the ultra-processed menu containing more calories on paper. It contained the same calories on paper. The difference was what people actually ate when the food was ultra-processed: faster, in larger quantities, past the point where the unprocessed menu left them satisfied.
The study has limits, and they should be stated plainly. It was small — twenty people — and short, at two weeks per diet. It swapped whole diets, so it cannot isolate a single cause: texture, eating speed, energy density, flavour intensity and other factors all moved together. It shows that ultra-processed diets can drive excess intake in the short term. It does not prove long-term weight trajectories, and it does not identify which feature of processing matters most. But as a demonstration that the food environment can move appetite by hundreds of calories a day without anyone deciding to overeat, it is the strongest evidence in the field — and it is hard to read it and still believe that appetite is a simple matter of choice. What makes a plate satisfying is not only what is in it but how it is built, and our companion article on understanding macronutrients works through how protein, carbohydrate, fat and fibre combine to make a meal — and why the same calories can feel very different depending on the food that carries them.
9.3 Sleep: short nights, hungrier days
Sleep is the most underappreciated lever on appetite, and the evidence for it is experimental, not only observational. In a small crossover study by Spiegel and colleagues in 2004, twelve healthy young men spent two nights sleeping four hours and two nights sleeping ten hours, with food and activity controlled. After short sleep, their leptin was eighteen percent lower, their ghrelin twenty-eight percent higher, their hunger twenty-four percent higher and their appetite twenty-three percent higher — and their appetite for calorie-dense, high-carbohydrate foods rose by thirty-three to forty-five percent. Two nights of short sleep moved both hormones in the direction of hunger, and moved food preference toward exactly the foods that deliver the most energy the fastest.
The effect survives beyond a single small study. A 2017 meta-analysis of sleep-restriction experiments found that partial sleep deprivation increased energy intake by about 385 kilocalories a day on average, with no meaningful increase in calories burned — people ate more and did not compensate by moving more. And the long-term associations point the same way: in the Nurses' Health Study, following 68,183 women, those sleeping five hours or fewer a night were fifteen percent more likely to develop obesity than those sleeping seven hours, and gained 1.14 kilograms more over sixteen years; a meta-analysis of seventeen cross-sectional studies covering 604,509 adults found that people sleeping fewer than five hours a night were fifty-five percent more likely to have obesity than those sleeping seven to eight hours.
All of those long-term figures are associations, not proof of causation, and they should be read that way — people who sleep little differ from people who sleep well in many other respects, and the arrows could run in both directions. But the experimental core is solid: restrict sleep, and leptin falls, ghrelin rises, hunger rises, and intake rises by hundreds of calories a day. Sleep is not a footnote to appetite regulation. It is one of its inputs, and a modern world that treats sleep as negotiable is feeding the system a false signal every night.
9.4 Stress: what can and cannot be said here
Stress belongs in this section, but it belongs here with a clear boundary around it. Chronic stress raises cortisol, and cortisol affects appetite, fat storage and metabolism — but the quantified causal chain from stress to cortisol to weight gain was not verified against a primary source in this session, and this article will not present one. What can be said is that stress changes eating behaviour in ways most readers will recognise: it shifts preference toward energy-dense, comforting foods, it disrupts sleep, and it narrows the attention available for cooking, planning and movement. The physiology behind the stress response — what cortisol does, and what its signs look like — is covered in depth in our companion article on high cortisol symptoms, which this article links to rather than re-deriving. Treat stress as an associated factor that makes the rest of the system harder to manage, not as a measured cause with a number attached.
9.5 Medications that can affect weight
Several widely used medication classes can contribute to weight gain, and this is worth knowing because it is one of the few environmental factors that can be discussed directly with a clinician. The classes most often listed are: certain antidepressants, such as amitriptyline, paroxetine and mirtazapine; antipsychotics, especially olanzapine and clozapine; corticosteroids such as prednisone, with long-term, higher-dose oral use; some diabetes drugs, including insulin and sulfonylureas; some anti-seizure drugs, including valproate and carbamazepine; older beta-blockers, such as atenolol, metoprolol and propranolol; and some antihistamines, such as diphenhydramine.
Three cautions come with that list. First, not everyone taking these medicines gains weight — the effect varies by drug, dose, duration and person. Second, no percentages are attached to any class here, because the specific figures circulating online rest on secondary patient-facing pages rather than primary data. Third, and most important: nobody should stop or change a prescribed medicine without talking to their clinician. The medicine is prescribed for a reason, and the weight effect — where it exists — is something to raise with the person who prescribed it, who may be able to adjust the dose, switch to an alternative, or add monitoring. Weight gain from a medicine is a side effect to manage, not a personal failing.
9.6 The gut microbiome: one short paragraph only, linking to the dedicated Gut Microbiome article
The trillions of microbes living in the gut influence digestion, immune function and metabolism, and research into their role in weight regulation is active and fast-moving — but the specific claims about the microbiome and obesity were not verified in this session, and this article will not add new ones. Readers who want the full picture should read our dedicated explainer, the gut microbiome explained, which covers what the microbes do, how diet shapes them, and where the evidence is solid and where it is still early.
9.7 Portion sizes, food marketing, and the built environment
No verified figures for portion-size growth over time were obtained in this session, and this article will not quote any. What can be said, on the WHO's general framing alone, is that the environment has changed in ways that all point the same direction: food is more available, more heavily marketed, more energy-dense and cheaper per calorie than it was a generation ago, while opportunities for everyday movement have narrowed in many places. The metabolic-ward experiment shows what happens when the food changes and nothing else does. The rest of the environment — marketing, portion norms, the design of streets and workplaces — is the same experiment running at the scale of whole societies, without a control group. The biology did not change. The world around it did.
10. Why Diets Fail: What Happens in the Body After Weight Loss
10.1 The Biggest Loser, six years later
The most cited follow-up in the field is also the most misunderstood, so it deserves a careful reading. Fourteen of the original sixteen contestants from a televised weight-loss competition were followed up six years after the show. At the end of the thirty-week competition they had lost an average of 58.3 kilograms, and their resting metabolic rate had fallen by 610 kilocalories a day. Six years later, they had regained 41.0 kilograms on average — and their resting metabolic rate was still 704 kilocalories a day below baseline. Metabolic adaptation — the fall in expenditure beyond what the lost tissue predicts — was 499 kilocalories a day below baseline at six years.
Three things about that study matter. First, the sample is tiny — fourteen people — and the intervention was extreme: thirty weeks of supervised, very-low-energy dieting and hours of daily exercise, under television cameras. Nothing about it resembles an ordinary diet. Second, it is an observational follow-up, not a controlled experiment, and it does not show that metabolic adaptation caused the regain. In fact, weight regain was not significantly correlated with metabolic adaptation at the end of the competition, and those who maintained greater weight loss at six years also had greater concurrent metabolic slowing — a pattern that suggests the slowing tracks the effort of maintaining the loss rather than simply causing the regain. Third, and most important, the study's conclusion is modest and precise. The slowing persists. It is proportional to the effort. And it is incomplete — it does not explain everything.
What the study does show, within those limits, is that the body's defence against weight loss does not switch off after a few months. Six years later, the furnace was still running hundreds of calories below where it started. Anyone who has lost a large amount of weight and found that keeping it off felt harder, year after year, than losing it in the first place will recognise the shape of that finding. It is not imagination. It is measurement.
10.2 The hormones do not go back: Sumithran 2011
If the Biggest Loser study shows the metabolism slowing, the Sumithran study shows the hormones refusing to return. In 2011, Sumithran and colleagues enrolled fifty patients with overweight or obesity and without diabetes in a ten-week very-low-energy diet programme. The average weight loss was 13.5 kilograms. As expected, the hormones moved: leptin fell by nearly two-thirds, along with peptide YY, cholecystokinin, insulin and amylin, while ghrelin, gastric inhibitory polypeptide and pancreatic polypeptide rose — and subjective appetite increased.
The striking part came a year later. At week sixty-two, one year after the initial weight loss, leptin was still 35.5 percent below baseline, ghrelin was still significantly higher than baseline, and peptide YY, cholecystokinin, insulin, gastric inhibitory polypeptide and pancreatic polypeptide were still significantly different from baseline, as was hunger itself. The authors' conclusion is the point of the paper: "One year after initial weight reduction, levels of the circulating mediators of appetite that encourage weight regain after diet-induced weight loss do not revert to the levels recorded before weight loss."
The study has a real limitation — it was single-arm, with no control group, and only thirty-four completers were analysed — all of them people who had lost at least ten percent of their body weight — so it shows persistence of hormonal changes, not proof that the hormones caused the regain. But persistence is the finding that matters for this article. A year after losing weight, the hormonal environment was still tilted toward regain: less leptin to report fullness, more ghrelin to prompt eating, more hunger on the questionnaires. The body had not accepted the new weight as normal. It was still, a year on, pushing back toward the old one.
10.3 Metabolic adaptation: the furnace turns down
The fall in expenditure beyond what lost tissue predicts has a name: adaptive thermogenesis. A review of the literature puts its size at roughly one hundred to five hundred kilocalories a day, varying between people, seen in lean and overweight subjects alike, and accounting for roughly half of the less-than-expected weight loss in patients with obesity. In the Leibel and Rosenbaum protocol it was about fifty to one hundred and forty kilocalories a day. The range is wide because people differ — in how much they lose, how fast, and how their bodies respond.
What adaptive thermogenesis means in practice is simple: the deficit you create by eating less shrinks, because the body spends less. Eat five hundred fewer calories a day, lose weight, and within months the body may be burning two or three hundred fewer — so the real deficit is no longer five hundred but two or three hundred, and it keeps shrinking as weight falls. That is why weight loss slows and plateaus even when the diet has not changed, and why maintaining the loss requires eating permanently less than a person of the same weight who never lost weight at all. The furnace does not merely get smaller with the house. It turns itself down.
10.4 The regain statistics, stated carefully
This is the section where a famous false statistic must be confronted directly. The claim that "95 percent of diets fail" — or that "95 percent of people who lose weight regain it within three to five years" — has no solid study behind it. Multiple secondary sources state this explicitly, and no primary study in this session supports the figure. It is a zombie number: repeated so often that it feels like data, but with no study at its root. The correct figures are less dramatic, more precise, and more useful — and they are stated here in terms of kilograms regained, not percentages of people, because that is what the studies actually measured.
Anderson and colleagues meta-analysed twenty-nine American studies of structured weight-loss programmes in 2001. Five years after completing a programme, the average person had maintained a weight loss of just over three kilograms — 23.4 percent of the initial loss, or 3.15 percent of initial body weight. Summarised the other way, and as Hall and Kahan's 2018 review puts it: on average, more than half of the lost weight was regained within two years, and about eighty percent by five years. That is a statement about kilograms — about how much of the lost weight came back, on average — not a statement that eighty percent of people regained the weight. The distinction matters, because averages hide a wide spread: some people in those studies kept most of the weight off, and some regained more than they had lost.
A 2021 systematic review and meta-analysis of 249 trials with 59,081 participants, with an average follow-up of two years, adds texture: weight regain after behavioural programmes was faster in intervention groups than in controls, and each kilogram lost at the end of a programme was associated with faster regain — but the weight difference compared with the control group was still maintained for at least five years. Programmes work, on average, and their effects fade, on average, and both halves of that sentence are true at once.
Study | What it measured | What it found |
|---|---|---|
Anderson et al., 2001 (29 studies) | Weight 5 years after structured programmes | Just over 3 kg maintained on average; about 80% of the weight lost regained by 5 years, on average |
Wing & Phelan, 2005 | Long-term success, defined as keeping off at least 10% of initial weight for at least 1 year | About 20% of people with overweight succeed by that definition |
Purcell et al., 2014 (200 adults) | Regain at 144 weeks after rapid (12-week) vs gradual (36-week) loss | About 71% regained in both groups — speed of loss made no difference |
STEP 1 extension (Wilding et al., 2022) | Weight 1 year after stopping semaglutide | About two-thirds of the loss regained (11.6 of 17.3 percentage points) |
National Weight Control Registry (via Wing & Phelan, 2005) | People who lost an average of 33 kg and kept it off 5+ years | Long-term maintenance is possible — in a self-selected group of people who succeeded, not a random sample of dieters |
Table 4: What the studies actually measured. Note the units: these are kilograms and percentages of weight lost, not percentages of people — except for Wing and Phelan's twenty-percent figure, which is explicitly a percentage of people meeting a defined success criterion.
Two other findings in that table deserve emphasis. First, about twenty percent of people with overweight do succeed at long-term weight loss by Wing and Phelan's definition — losing at least ten percent of initial body weight and maintaining it for at least a year. One in five is not a rare exception. It is a substantial minority, and it is the reason the "ninety-five percent fail" figure is not only wrong but harmful: it tells the one person in five that they are an impossibility. Second, the speed of weight loss made no difference to regain. In Purcell and colleagues' randomised trial, two hundred adults were assigned to lose weight rapidly over twelve weeks or gradually over thirty-six weeks, aiming for the same fifteen-percent loss; at 144 weeks — nearly three years — both groups had regained around seventy-one percent of what they had lost. The folk wisdom that slow loss is more sustainable than fast loss did not survive the test.
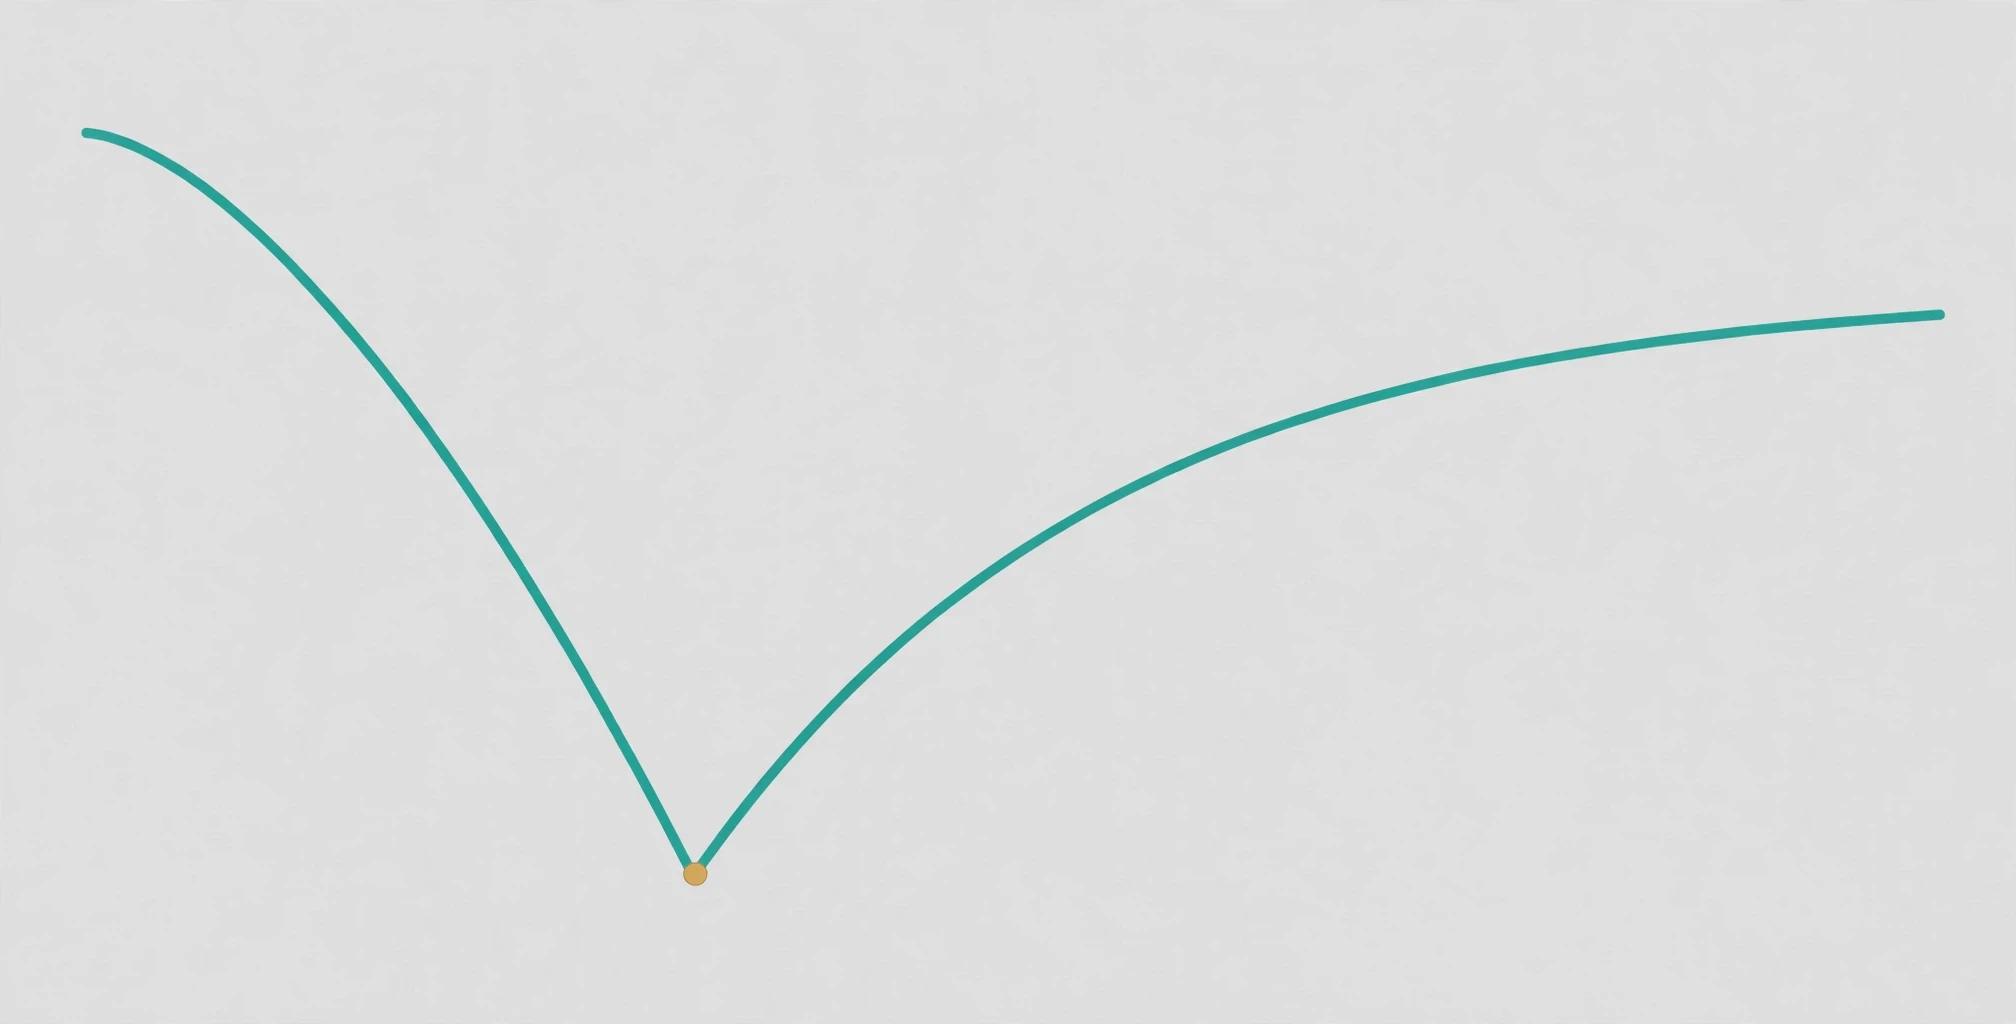
10.5 Set-point, settling-point, or dual intervention point?
Why does the body defend lost weight so stubbornly, while apparently letting weight rise for decades with little resistance? Three models compete to explain it, and researchers still disagree about which is right.
Set-point theory, articulated in the 1980s, proposes that the body defends a particular weight through compensatory adjustments to hunger, satiety, energy expenditure and food reward — like a thermostat holding a room at a set temperature. The strict version, a single rigid biologically determined weight defended equally against loss and gain, does not match population data: people gain weight gradually over decades with little apparent resistance, then find it very hard to lose. If the thermostat were strict, the decades of gain would have been resisted too.
The leading alternatives are the settling-point model, in which weight settles where intake and expenditure balance given the environment — change the environment and the weight settles somewhere new — and the dual-intervention-point model, in which the body defends strongly below a lower bound and weakly above an upper bound: weight loss is biologically defended, weight gain is environmentally permitted. That asymmetry fits the population data better than a strict set point: the lower bound is guarded, the upper bound is left open, and the environment determines how far above the lower bound weight drifts.
A 2025 review in Nature Reviews Endocrinology concluded that the mechanisms governing human body weight remain incompletely understood and that the competing models still need direct experimental testing; a 2023 review by Speakman and Hall reached a similar conclusion. There is no clinical test that can measure an individual's personal "set point", and a previous weight is not proof that the body is programmed to return to it. The models are frameworks for thinking, not measurements — and the honest state of the science is that the thermostat exists, its lower bound is well defended, and the precise rules it follows are still being worked out.
10.6 Why "willpower" is the wrong unit of analysis
Pull the threads together and the picture is coherent. Leptin reports fat stores to the brain, and the brain listens less when there is more of it. Ghrelin prompts meals, and it rises when sleep is short. The hypothalamus weighs these signals and tilts appetite up or down. After weight loss, leptin falls and stays low, ghrelin rises and stays high, the resting metabolic rate falls beyond what the smaller body explains, and the food environment keeps offering the cheapest, fastest, most rewarding calories available. None of those forces is willpower. All of them act on willpower's terrain, every day, at every meal.
That is why "willpower" is the wrong unit of analysis for weight. It treats a regulated system as though it were a character trait, and it locates the failure in the person rather than in the mismatch between a defended biology and an environment that pushes against it. None of this means change is impossible — one person in five keeps a substantial loss off for a year or more, and the Registry's long-term maintainers show that maintenance, though uncommon, is real. It means the difficulty is real too, and that it has a biological address: the hormones that do not revert, the metabolism that stays slow, the brain that keeps defending the old weight, and the world that keeps making weight gain the path of least resistance.
"Metabolic adaptation persists over time and is likely a proportional, but incomplete, response to contemporaneous efforts to reduce body weight." — Fothergill et al., Obesity, 2016
11. GLP-1 Medicines: What They Do, and What They Don't Prove
11.1 The mechanism: a gut hormone, mimicked
GLP-1 — glucagon-like peptide-1 — is a hormone the gut releases after eating. It stimulates the pancreas to release insulin when blood sugar is high, suppresses the hormone glucagon, slows the emptying of the stomach, and acts on receptors in the brain, including the hypothalamus and brainstem, to reduce appetite. It is, in other words, one of the gut's own fullness signals — the same family of signals described in section 4.
GLP-1 receptor agonists, such as semaglutide and liraglutide, mimic this hormone, and the dual GIP/GLP-1 agonist tirzepatide mimics two gut hormones at once. Semaglutide's half-life of about a week allows once-weekly dosing. The mechanism is worth stating plainly, because it explains both the power of these medicines and their limits: they do not rewire the appetite circuits or repair leptin signalling. They amplify one of the gut's own satiety signals, loudly and continuously, and the brain responds by reducing appetite. Turn the signal off, and the appetite returns — which is exactly what the discontinuation trials show.
11.2 What the trials showed: STEP 1
The pivotal trial, STEP 1, randomised 1,961 adults with overweight or obesity and without diabetes to once-weekly semaglutide 2.4 milligrams or placebo for sixty-eight weeks, both alongside lifestyle counselling. At week sixty-eight, the average weight change was 14.9 percent lost on semaglutide against 2.4 percent on placebo — a difference of 12.4 percentage points. More than four in five people on semaglutide — 86.4 percent — lost at least five percent of their body weight, against 31.5 percent on placebo. Those are averages from a randomised, double-blind trial, and they are the largest average losses seen from a medicine at the time. They are also averages, not promises: individual responses ranged widely, and gastrointestinal side effects were common, leading some participants to stop treatment.
11.3 What happens when they stop: ~two-thirds regained within a year
The most informative number about these medicines is not what happens while people take them. It is what happens when they stop. In the STEP 1 extension, 327 participants were followed for one year after semaglutide and the lifestyle programme were both stopped at week sixty-eight. They had lost 17.3 percent of their body weight by week sixty-eight. By week 120 — a year off treatment — they had regained 11.6 percentage points, or about two-thirds of the loss, ending 5.6 percent below baseline, while the placebo group ended almost exactly where it had started. Cardiometabolic improvements — blood pressure, lipids, blood sugar — moved back toward baseline as well. The extension was exploratory, covered a subset of sites, and withdrew the drug and the lifestyle support together, so their contributions cannot be separated. But the direction is unambiguous.
Randomised withdrawal trials confirm the pattern. In STEP 4, switching from semaglutide to placebo led to a 6.9 percent weight gain over forty-eight weeks. In SURMOUNT-4, switching from tirzepatide to placebo led to a 14.0 percent gain over fifty-two weeks. The medicines work while they are taken, because the signal they amplify is present while they are taken. When the signal stops, the underlying regulation — the same leptin, ghrelin and hypothalamic machinery described in the rest of this article — reasserts itself, and weight returns. That is not a failure of the medicines. It is a demonstration of what they are: a continuous treatment for a chronic, regulated condition, not a reset of the regulation itself.
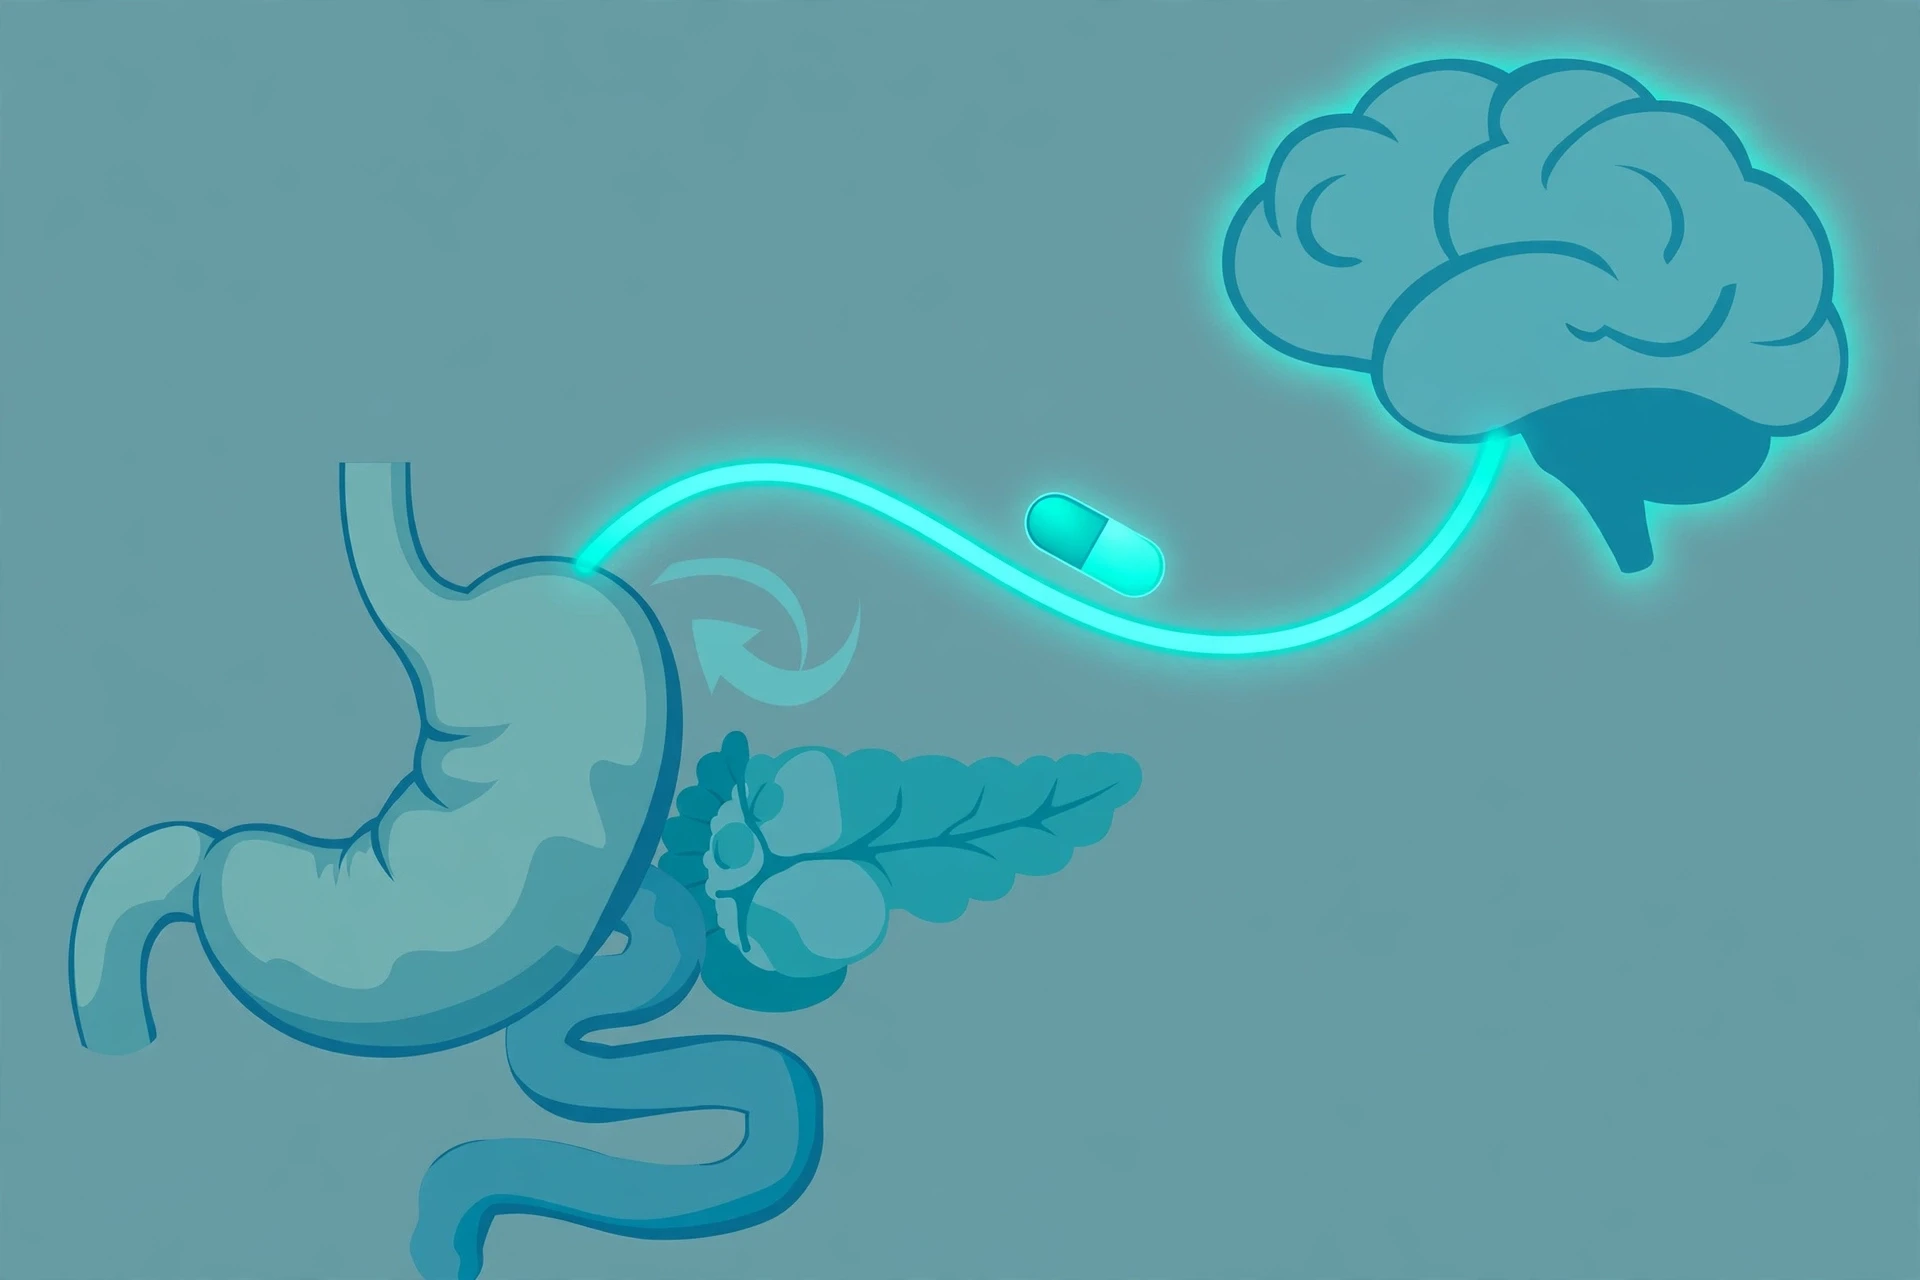
11.4 What WHO said in December 2025
In December 2025, the World Health Organization published its first global guideline on GLP-1 therapies for obesity in adults. It made two conditional recommendations: first, that GLP-1 receptor agonists or dual GIP/GLP-1 agonists — liraglutide, semaglutide, tirzepatide — "may be used" as long-term treatment, for six months or more, in adults over nineteen living with obesity, excluding pregnancy, on moderate-certainty evidence; second, that intensive behavioural therapy "may be provided" alongside them, on low-certainty evidence.
The word "conditional" carries the weight. The recommendations are conditional because of limited long-term safety and maintenance data, high costs, and equity and access concerns — and the WHO projects that fewer than ten percent of those who could benefit will have access by 2030. The guideline is a careful, qualified endorsement of a treatment for a chronic condition, not a declaration that obesity has been solved.
11.5 What this section is not: no recommendation, no dosing, no suitability advice, no efficacy promise for any individual; "talk to a clinician" framing only
This section describes a mechanism and reports trial averages. It does not recommend any medicine, give dosing information, advise anyone on suitability, or promise any individual a particular result. Whether a GLP-1 medicine is appropriate for a given person depends on their health, their other conditions, their other medicines, and their circumstances — and that assessment belongs to a clinician who knows them. Anyone considering these medicines should have that conversation, with full information about benefits, side effects, costs and the likelihood of regain if treatment stops.
12. Common Mistakes and Misconceptions About Obesity
I have lost count of the times I have seen the "ninety-five percent of diets fail" figure quoted as though it were a fact — in articles, in clinic waiting rooms, in conversation. Each time, the figure does the same damage: it tells people who are struggling that failure is the norm, and it tells people who succeeded that they are a statistical impossibility. The figure has no study behind it. That is the pattern of most misconceptions about obesity: they sound like common sense, they flatter a simple story, and they fall apart against the evidence. Ten of them follow, each with the correction the evidence supports.
12.1 "Obesity is just eating too much and moving too little"
Energy balance is real — the ledger cannot be repealed — but appetite, expenditure and the environment are regulated, and the regulation does most of the work. The metabolic-ward experiment showed the same people eating five hundred extra calories a day when only the menu changed. Twin studies showed the same calorie surplus producing three times as much weight gain in one pair of twins as in another. "Eat less, move more" describes the arithmetic. It does not describe the machinery that decides how much a person eats or how much energy they burn, and it is the machinery that explains why the arithmetic is so hard to sustain.
12.2 "It's a lack of willpower"
Twin studies put the share of BMI variation between people that comes from genes at roughly forty to seventy percent. The hormones that report fat stores stay shifted for a year or more after weight loss. Metabolism slows beyond what the smaller body predicts. The environment makes energy-dense food the cheapest and most available option. Willpower is a real human capacity, and people use it every day — but it is a small lever on a large machine, and the machine pushes back at every meal. Blaming willpower mistakes the size of the lever for the size of the problem.
12.3 "95% of diets fail"
No study says this. The figure has no solid study behind it, and it should not be quoted. What the evidence actually shows, from Anderson and colleagues' meta-analysis of twenty-nine programmes, is that on average just over three kilograms were maintained at five years, and on average about eighty percent of the weight lost was regained by five years. Those are kilograms, not a percentage of people — and they sit alongside the finding that about one person in five keeps at least ten percent of their initial weight off for a year or more. The honest numbers are less dramatic than the myth and far more useful, because they describe a real distribution of outcomes instead of a false certainty of failure.
12.4 "A 500-kcal deficit always loses a pound a week"
The 3,500-kcal rule was a 1958 calculation about the energy stored in a pound of fat, not a tested prediction of weight loss over time. Hall's dynamic model showed it overestimates weight loss by about one hundred percent over three years, because it assumes all lost weight is fat and that expenditure never adapts. The better rule of thumb is that a permanent change of about ten kilocalories a day eventually moves weight by about one pound, with half the change arriving in the first year. A five-hundred-calorie deficit does not produce a pound a week, every week, indefinitely. It produces a curve that bends, flattens, and settles.
12.5 "Leptin supplements fix leptin resistance"
There is no clinical test for leptin resistance, no agreed definition of it, and no supplement that contains leptin — leptin is a protein hormone that would be digested if swallowed, and it is not sold over the counter. Products marketed for leptin resistance have no documented effect on leptin signalling in humans. The underlying biology — a brain responding less to abundant leptin — is real as an observation. The products are not a response to it.
12.6 "Your body has one fixed set-point weight"
There is no measurable personal set point and no test that can find one. A single rigid weight, guarded just as firmly against gain as against loss, does not match population data, which show weight rising for decades with little resistance and then resisting loss fiercely. The current alternatives, the settling-point model and the dual-intervention-point model, fit better: weight settles where intake and expenditure balance, and the body guards more fiercely against loss than against gain. The reviews from 2023 and 2025 both left the mechanism question open. The thermostat is real. Its exact setting is not a number anyone can measure in you.
12.7 "BMI tells you whether you're healthy"
BMI is a screening tool, not a diagnosis. It cannot distinguish muscle from fat, cannot see where fat sits, and cannot say whether excess fat is harming any organ. The 2025 Lancet Commission framework keeps BMI as the screen and adds confirmation of excess fat and an assessment of whether organs are actually affected — clinical obesity versus pre-clinical obesity. A BMI of thirty-one in a heavily muscled person and a BMI of thirty-one in a person with visceral fat around the liver are the same number and very different situations.
12.8 "All fat is the same"
Most body fat sits just under the skin, where it is relatively inert. A smaller share, visceral fat, packs around the organs inside the abdomen — and that share carries most of the metabolic risk: insulin resistance, type 2 diabetes, heart disease and fatty liver. Visceral fat drains into the portal vein, delivering free fatty acids and inflammatory signals directly to the liver. The same BMI can hide very different amounts of visceral fat, which is one more reason BMI alone cannot judge health, and why waist circumference adds information that weight alone misses. Section 1 described this difference and the companion article on visceral and subcutaneous fat works through it in full.
12.9 "Once you lose weight, the hard part is over"
The hard part, for most people, starts after the loss. Sumithran's study showed the hormones that encourage regain still shifted a full year after weight loss — leptin still down by more than a third, ghrelin still up, hunger still higher. Fothergill's follow-up showed resting metabolism still hundreds of calories below baseline six years later. The body does not accept a new lower weight as normal on the timescale of a diet. It keeps pushing back for years. That is not a reason to regard weight loss as pointless — the health benefits of even modest sustained loss are real — but it is a reason to stop describing maintenance as the easy part. Maintenance is the part where the biology pushes hardest.
12.10 "GLP-1 medicines 'cure' obesity"
They do not. They amplify a gut satiety signal while they are taken, and the trials show large average losses while they are taken. They also show what happens when they stop: about two-thirds of the lost weight returns within a year in the STEP 1 extension, and randomised withdrawal trials show substantial regain when people switch to placebo. The WHO's December 2025 guideline recommends them conditionally, as long-term treatment, with explicit concern about limited long-term data, cost and access. A treatment that works while it is taken, for a chronic regulated condition, is a treatment — not a cure.
13. FAQ
What is leptin?
Leptin is a hormone made by fat tissue that tells the brain how much energy is stored. It was discovered in 1994, when Jeffrey Friedman and colleagues cloned the mouse ob gene and its human counterpart; the hormone is named from the Greek leptos, meaning "thin". Fat cells release leptin in proportion to fat mass, and the brain — mainly the hypothalamus — reads the level and adjusts hunger and energy expenditure. It tracks energy stores over weeks and months, rather than signalling fullness after a single meal. People born without leptin develop severe early-onset obesity, and leptin replacement transforms their appetite and weight — but that condition is extremely rare, and most people living with obesity have high leptin, not low leptin.
What is ghrelin?
Ghrelin is a hormone made mainly by the stomach that stimulates appetite — often called the "hunger hormone". Kojima and colleagues identified it in 1999, while searching for the natural ligand of the growth-hormone secretagogue receptor. Ghrelin is a 28-amino-acid peptide, the only known appetite-stimulating hormone produced by the gut. Blood levels climb in the hour or two before a meal and drop within roughly an hour afterwards, and giving ghrelin increases food intake. It acts on the same hypothalamic neurons as leptin, but in the opposite direction — exciting the hunger-promoting NPY/AgRP neurons that leptin suppresses. It also has roles in reward, sleep and memory, though those are less firmly established than its role in feeding.
What is leptin resistance?
Leptin resistance is the observation that the brain responds less to leptin even though blood leptin is high — which is the usual situation in common obesity, where more fat tissue means more leptin. Proposed mechanisms include impaired transport of leptin across the blood–brain barrier, dampened signalling inside neurons through the JAK2–STAT3 pathway, reduced leptin-receptor expression, hypothalamic inflammation and cellular stress. But there is no agreed clinical definition and no test that can tell whether a given person is leptin resistant; a 2012 paper from a National Institutes of Health workshop concluded the field lacked robust, easily measurable biomarkers of leptin's action. It is a description of an observation, not a diagnosis — and no supplement "for leptin resistance" contains leptin or has a documented effect.
Why is weight loss hard?
Because the body defends its weight. After weight loss, the hormones that encourage regain stay shifted for a year or more — in Sumithran's 2011 study, leptin was still more than a third below baseline a year later and ghrelin was still elevated, with hunger still higher. Resting metabolism falls beyond what the smaller body predicts: in the Biggest Loser follow-up, it was still about 700 calories a day below baseline six years later. Appetite rises, expenditure falls, and the food environment keeps pushing in the same direction. None of that means weight loss is impossible — roughly a fifth of people who lose weight keep at least ten percent off for a year or more — but it explains why losing weight and keeping it off are two different challenges, and why the second is usually the harder one.
Does your body have a set point weight?
Not in the sense of a single fixed number that can be measured. A rigid weight defended just as strongly against gain as against loss does not fit the population data, since weight rises for decades with little resistance and then resists loss. The alternatives that fit better are the settling-point model, where weight settles where intake and expenditure balance, and the dual-intervention-point model, where the body guards strongly below a lower bound and only weakly above an upper one — so loss is defended and gain is permitted. Both reviews left the underlying mechanisms an open question, and there is no clinical test for a personal set point. The defence against loss is real; a fixed number for it is not.
What causes obesity?
There is no single cause. Obesity arises from genes, brain regulation and environment acting together. Twin studies put the heritability of BMI variation at roughly forty to seventy percent, and hundreds of genetic variants nudge appetite and metabolism. The brain's appetite circuits — leptin, ghrelin and the hypothalamic neurons they act on — regulate hunger and expenditure, and they defend lost weight. And the environment has changed faster than the biology: ultra-processed food that drives spontaneous overeating, short sleep that raises ghrelin and lowers leptin, chronic stress, medications that affect weight, and surroundings that make movement harder. No one of these explains obesity on its own. Together, they explain why it has become so common, so fast.
Why do I regain weight after dieting?
Because the systems that regulate weight keep pushing back after the diet ends. In Sumithran's study, the hormonal shifts that encourage eating were still present a year after weight loss. In the Biggest Loser follow-up, resting metabolism was still hundreds of calories below baseline six years later. Anderson's meta-analysis found that, five years on, roughly four-fifths of the weight lost in structured programmes had returned (Anderson et al., 2001) — a statement about kilograms, not about the percentage of people. The same pattern appears with medicines: about two-thirds of the weight lost on semaglutide returned within a year of stopping in the STEP 1 extension. Regain is not a verdict on character. It is the regulated system doing what it evolved to do, in an environment that makes it easy.
14. Conclusion: What the Science Actually Says
Weight is regulated. That is the sentence this whole article has been building toward, and it is worth stating plainly at the end: the body measures its own fat stores, reports them to the brain through leptin, times its meals through ghrelin and the gut, weighs those signals in the hypothalamus, and defends the result with hunger and a slower metabolism. It is a control system, and like any control system it can be understood, measured and described — which is what the last thirty years of research, from Coleman's joined mice to the metabolic ward in Bethesda, have done.
The environment has shifted faster than the biology. In a single generation, adult obesity more than doubled and adolescent obesity quadrupled, and the change is not in the genes — those do not rewrite themselves in thirty years. It is in the food on offer, the hours of sleep people get, the medicines they take, the design of streets and workplaces, and the marketing that surrounds every meal. A regulatory system built to defend against famine now operates in a world of constant plenty, and it defends the weight that world produces with the same machinery that once defended against starvation. The body is not broken. It is doing the job evolution gave it, in an environment it was not built for.
What remains unknown is considerable, and honesty requires naming it. Researchers still disagree about which model of weight regulation is right — set point, settling point, or dual intervention point — and the competing models still need direct experimental testing. There is still no way to measure leptin resistance in an individual, and no agreed definition of it. Long-term data on the GLP-1 medicines, beyond a few years, are still accumulating, and the WHO's conditional guideline reflects exactly that uncertainty. The science is strong on the mechanisms and candid about the gaps, and that combination is more trustworthy than certainty would be.
The puzzle from the opening pages resolves into something less mysterious and more sobering. The volunteers in the metabolic ward were not weak-willed; they were responding to food engineered to be easy to overeat, through a brain that reads fullness slowly and hunger quickly. The contestants who regained the weight were not failures; they were living with a metabolism that was still running hundreds of calories below baseline six years later, and hormones that had not returned to normal after a year. None of that makes weight fixed for life, and none of it excuses the world that makes change so hard. It explains the difficulty without excusing it or blaming anyone for it — and that explanation, on its own, is a better place to start than the story we started with.
This article is for general education about the science of obesity. It does not give personal medical advice. If you have questions about your own weight or health, please talk to a clinician who knows you.
15. Sources
World Health Organization, "Obesity and overweight" fact sheet (2024 data)
CDC/NCHS blog, "NCHS Releases Updates to Obesity Estimates" (25 February 2026)
US National Cancer Institute, "Obesity and Cancer" fact sheet
Frontiers in Endocrinology mini-review, leptin resistance (2021)
Ghrelin review, International Journal of Molecular Sciences 2021;22:3763
Ghrelin literature review, Nigerian Journal of Surgery (PMC)
BMB Reports review, "Network of hypothalamic neurons that control appetite"
JAMA 2026 review, "Sleep Health and Obesity" (PMC), DOI: 10.1001/jama.2026.9551
Drugs.com, "Weight gain" (medically reviewed, updated 30 November 2025)
Obesity Action Coalition, "Can Medications Affect Your Weight?"
Healthcare-in-Europe report of the Nature study testing the Lancet Commission framework (2026)
BurnWeek, "Leptin Resistance Explained: The Evidence" (citing the 2012 NIH workshop)
MedCompanions appetite-hormone explainer (AgRP / POMC / PYY)
Kcalm explainer, the 3,500-calorie rule and the Hall model (Hall et al., Lancet 2011)
Secondary summary of the set-point literature (no measurable personal set point)