

Introduction
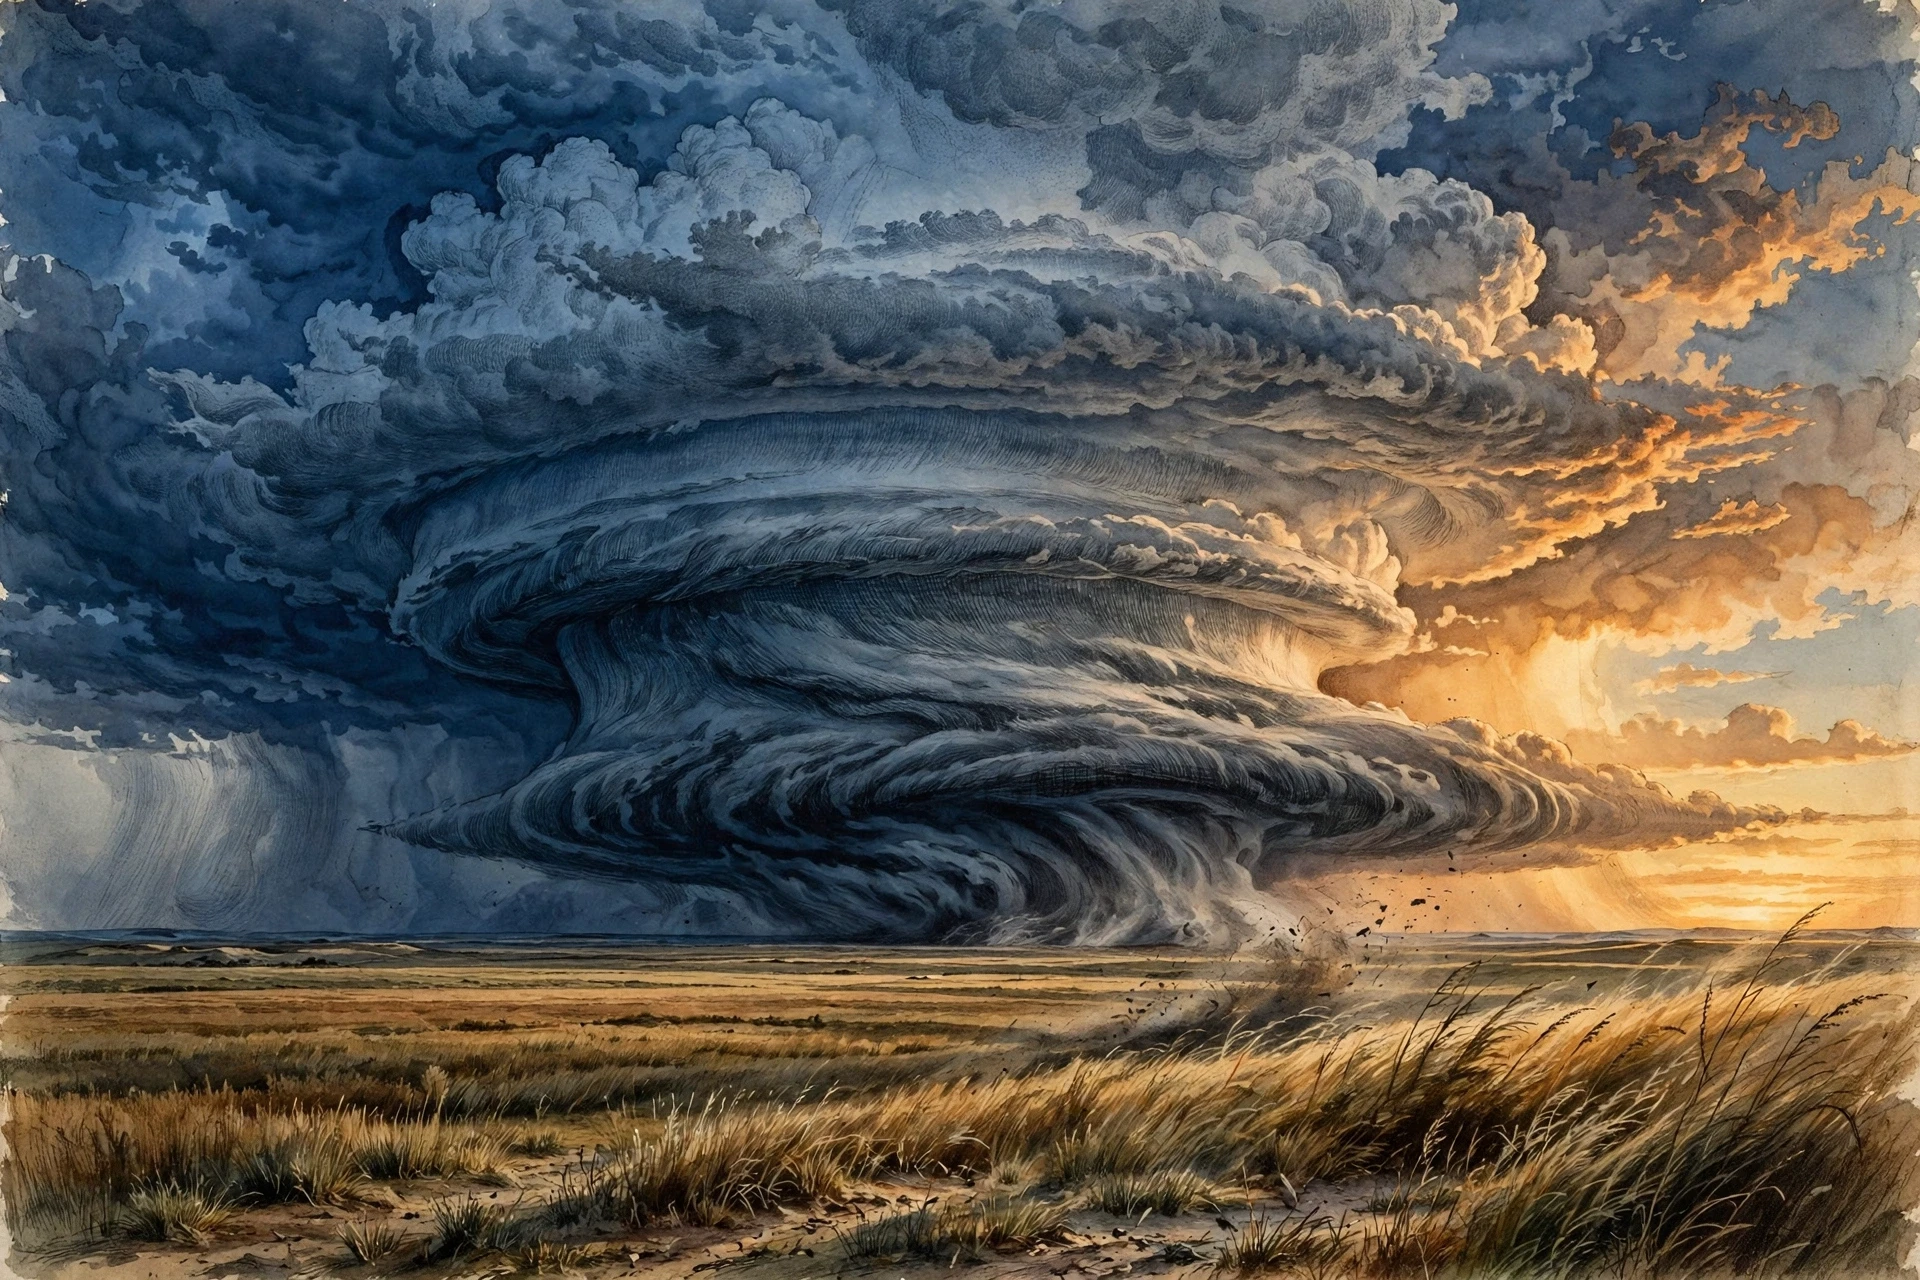
The sky turned green over the Kansas plain, and every hair on my arms stood up. I was twenty-three, standing beside a battered field station with a notebook in one hand and a cheap anemometer in the other, watching meteorology happen in real time as a supercell thunderstorm built itself out of nothing. Ten minutes earlier the air had been warm and still, the kind of heavy afternoon that makes you want to sit in the shade. Then the wind shifted, the temperature dropped five degrees in as many minutes, and a wall of cloud rose on the horizon like a dark mountain range that had learned to move. A farmer leaned out of his pickup and shouted the only advice that mattered: "Get inside, or get a good look — you don't get both." I got the good look, and I have been trying to explain what I saw ever since.
That afternoon is why I study meteorology, the science of the atmosphere and the weather it makes. Meteorology is not really about whether you need an umbrella tomorrow, though it is about that too. It is about a thin skin of gas, barely a hundred kilometres deep, that wraps a whole planet and decides where rain falls, where crops grow, where planes can fly, and where people can safely live. It is physics you can feel on your skin: heat rising off a road, wind pushing at a door, rain arriving cold on a warm day. And it is one of the few sciences where the laboratory is the sky above your head, running its experiments every hour of every day, whether anyone is watching or not.
This guide follows the whole chain, from sunlight striking an uneven Earth to the supercomputer forecast on your phone. We will walk through the layers of the atmosphere, the engine that drives wind, the water that makes clouds and rain, the fronts where air masses collide, and the great storms — thunderstorms, tornadoes, hurricanes, blizzards — that are the atmosphere letting off steam. Then we will look inside the forecast itself: the balloons, satellites, radar dishes, and equations that turn measurements into a prediction, and the honest limits of that prediction. Along the way, I will tell you where the science surprised me, where forecasters got it wrong in instructive ways, and where the newest research is pushing the field forward.
1. What Meteorology Is — and What It Is Not
1.1 The science of the air
Meteorology is the scientific study of the atmosphere: its physics, its chemistry, and the processes that create weather. A meteorologist studies temperature, air pressure, humidity, wind, clouds, and precipitation — and, just as importantly, how those things change over hours and days. The word comes from the Greek meteoros, meaning "high in the air", and it has been in use for more than two thousand years. Aristotle wrote a book called Meteorologica, and while much of what he guessed was wrong — he thought winds came from dry exhalations of the Earth — he was right about the central idea: the sky is not random. It follows rules, and rules can be learned.
The field sits inside the wider atmospheric sciences, alongside climatology and atmospheric chemistry. It draws on physics for the motion of air, on chemistry for what happens inside a cloud droplet, on mathematics for the equations that describe a storm, and on computing for the models that run those equations millions of times a second. A working meteorologist is part physicist, part detective, and part translator: they take a sky full of invisible motion and turn it into a sentence a farmer, a pilot, or a parent planning a school trip can use.
I learned how much translation matters during my first week in an operational forecasting office. The senior forecaster on shift looked at a wall of charts, muttered "the low is deepening faster than the model thinks", and rewrote the evening forecast in thirty seconds. A student asked him how he knew. He pointed at a single wavy line on a map and said, "That is a jet streak. It has been wrong before, and it will be wrong again, but not like this." The model had the numbers. He had the memory of a hundred similar nights. Meteorology lives in that gap between the equation and the experience.
1.2 Weather is not climate
Most people assume weather and climate are two words for the same thing, but what we actually see in the data is two different questions. Weather is the state of the atmosphere at a particular place and time: the temperature outside your window right now, the rain that fell this morning, the wind that will pick up this evening. Climate is the long-term pattern of that weather, usually averaged over thirty years: how hot your summers usually are, how often it rains in October, how cold the coldest winter night tends to be. The old saying gets it right — climate is what you expect, weather is what you get.
The World Meteorological Organization puts the distinction plainly: weather describes short-term events, while climate describes average conditions over long periods, usually years or decades, and a climatological standard is computed from thirty years of data. That distinction matters because a single cold snap does not disprove a warming climate, and a single hot summer does not prove one. Both are weather. Climate is the pattern those days add up to, and it takes years of careful records to see it move. The World Meteorological Organization notes that weather forecasts support decisions from safe transport to agriculture to lifesaving action before hazards such as tropical cyclones and floods — a reminder that the difference between weather and climate is not academic. One tells you what to wear today. The other tells you what kind of world your children will dress for.
1.3 Why the sky matters to everyone
Weather is the most democratic science there is. It does not care who you are. A heatwave closes schools, a blizzard closes airports, a drought empties reservoirs, and a hurricane redraws a coastline in a night. Farmers plant by it, airlines route around it, energy grids balance against it, and emergency managers plan their whole year around the storms it might bring. The National Weather Service states its mission plainly: to provide weather, water, and climate data, forecasts, and warnings for the protection of life and property. That is not marketing language. In the United States alone, weather warnings are the difference between a family evacuating in time and a family caught in a flood.
There is also a quieter reason to learn meteorology. Once you can read the sky — a line of cumulus towers, a falling barometer, a halo around the Moon — the world gets bigger. A grey morning stops being a mood and becomes a story: warm air sliding over cold, moisture condensing a kilometre overhead, a front moving in from the west. That story is the subject of this article.
2. The Atmosphere: A Thin Ocean We Live At the Bottom Of
2.1 An ocean of air
Imagine the Earth wrapped in an ocean of gas so thin, compared with the planet, that it is like the skin on an apple. That is the atmosphere. It is roughly 100 kilometres thick if you count to the edge of space, but half of its mass sits in the lowest 5.5 kilometres, and almost all of our weather happens in the lowest 10 to 15 kilometres. We live at the bottom of this ocean, under the weight of all the air above us, and we barely notice it — until a storm reminds us that the ocean can move.
Dry air is about 78% nitrogen and 21% oxygen, with roughly 1% argon and small amounts of carbon dioxide and other gases. Water vapour is the wild card: it can be almost nothing in a desert or up to 4% of the air in the humid tropics, and that small share drives an enormous share of the weather. Water vapour is the fuel of storms, the raw material of clouds, and the reason a humid summer day feels so much heavier than a dry one at the same temperature.
2.2 Five layers, one weather layer
The atmosphere is divided into layers by how temperature changes with height. The troposphere, the lowest layer, runs from the surface to about 8 kilometres over the poles and about 16 kilometres over the equator. Temperature falls with height here, which is why mountain tops are cold even in summer. Almost all weather — clouds, rain, storms — lives in the troposphere, because this is where warm air rises and cool air sinks, stirring the whole layer like a pot on a stove.
Above it sits the stratosphere, where temperature rises with height because ozone absorbs ultraviolet light. The stratosphere is calm and layered, which is why long-haul jets cruise there, above the weather. Above that come the mesosphere, where meteors burn up, and the thermosphere, where auroras glow and the air is so thin that a thermometer would read hundreds of degrees yet you would freeze, because there are too few molecules to carry heat to your skin. The boundary that matters most for weather is the tropopause, the lid between the troposphere and the stratosphere. It caps rising air like a ceiling, and the tops of the tallest thunderstorms flatten against it into the anvil shapes you can see from miles away.
The first time I launched a weather balloon, I watched the little white package rise until it was a speck, and I thought about what it was passing through: the warm, wet, turbulent layer where we live, then the cold lid, then the strange calm above. The balloon reported back every few seconds — temperature, humidity, pressure, wind — until it burst, high above the clouds, and fell back to Earth on a small parachute. That single balloon gave the forecasters more useful information about the next day's storms than a week of looking out of the window. The sky is not one thing. It is layers, and each layer has its own rules.
2.3 Pressure: the weight of the sky
Air has weight, and the weight of the whole column of air above you is air pressure. At sea level it is about 1013 hectopascals, which means roughly ten tonnes of air pressing down on every square metre — the weight of a small truck, held up by the air pushing back from below and from the sides. You do not feel it because the pressure inside your body matches it. You feel it change: when pressure falls, the air is lighter overhead, and your ears may pop on a mountain road; when it falls fast, a storm is usually coming.
Pressure is the engine of wind. Air always flows from high pressure toward low pressure, the way water flows downhill. The steeper the difference — the closer together the lines on a weather map — the stronger the wind. A gentle gradient gives a breeze. A steep gradient around a deep low-pressure system gives a gale. Everything else in meteorology — fronts, storms, the great global winds — is a consequence of air trying to even out pressure differences, and the Earth spinning underneath it while it tries.

3. The Engine: How Sunlight Makes Wind
3.1 Uneven heating
Every weather event on Earth traces back to one energy source: the Sun. The Sun heats the Earth unevenly because the Earth is a sphere tilted on its axis — a tilt that shapes the seasons across our solar system and the climate of every planet in it. The tropics receive sunlight almost straight down, concentrated on a small area. The poles receive the same sunlight spread thinly at a slant, and for months of the year, in winter, almost none at all. Land heats and cools faster than water. Dark ground heats faster than snow. A city heats faster than the fields around it.
The atmosphere spends all its time trying to fix that unevenness, moving heat from warm places to cool ones. That movement is weather. Warm air expands, becomes less dense, and rises. Cool air is denser and sinks. The rising and sinking sets up great loops of circulation, and the wind is the air moving along those loops. A simple rule runs through all of it: the Sun makes temperature differences, temperature differences make pressure differences, and pressure differences make wind.
I once watched this rule work on a beach at noon. The sand was hot enough to sting bare feet, while the sea stayed cool. By mid-afternoon a sea breeze had set in, cool air flowing in from the water to replace the hot air rising off the sand. By evening, after the land had cooled faster than the sea, the breeze reversed. Nobody had switched anything on. The Sun, the sand, and the sea had done it all, on a scale small enough to feel on your face and large enough to explain the trade winds.
3.2 The Coriolis effect: the Earth spins under the wind
If the Earth did not spin, air would flow in straight lines from the equator to the poles and back. But the Earth does spin — once a day, carrying everything on it around at up to 1,670 kilometres per hour at the equator. Moving air gets deflected by that spin: to the right in the Northern Hemisphere, to the left in the Southern Hemisphere. This is the Coriolis effect, and it is why storms spiral instead of rushing straight in, why winds blow around high and low pressure systems instead of directly into them, and why the great wind belts of the planet run in the directions they do.
A common mistake is to say the Coriolis effect makes water swirl down a bathtub drain in different directions in each hemisphere. It does not — a drain is far too small, and the shape of the basin decides the swirl. The Coriolis effect only shows its hand on large scales, over hundreds of kilometres and many hours. On that scale it is decisive. Air flowing toward a low-pressure centre is bent sideways, so instead of filling the low, it circles it: counterclockwise in the Northern Hemisphere, clockwise in the Southern. Around a high, the flow goes the other way. That circling is the signature of weather systems on every satellite image ever taken.
3.3 The global wind belts
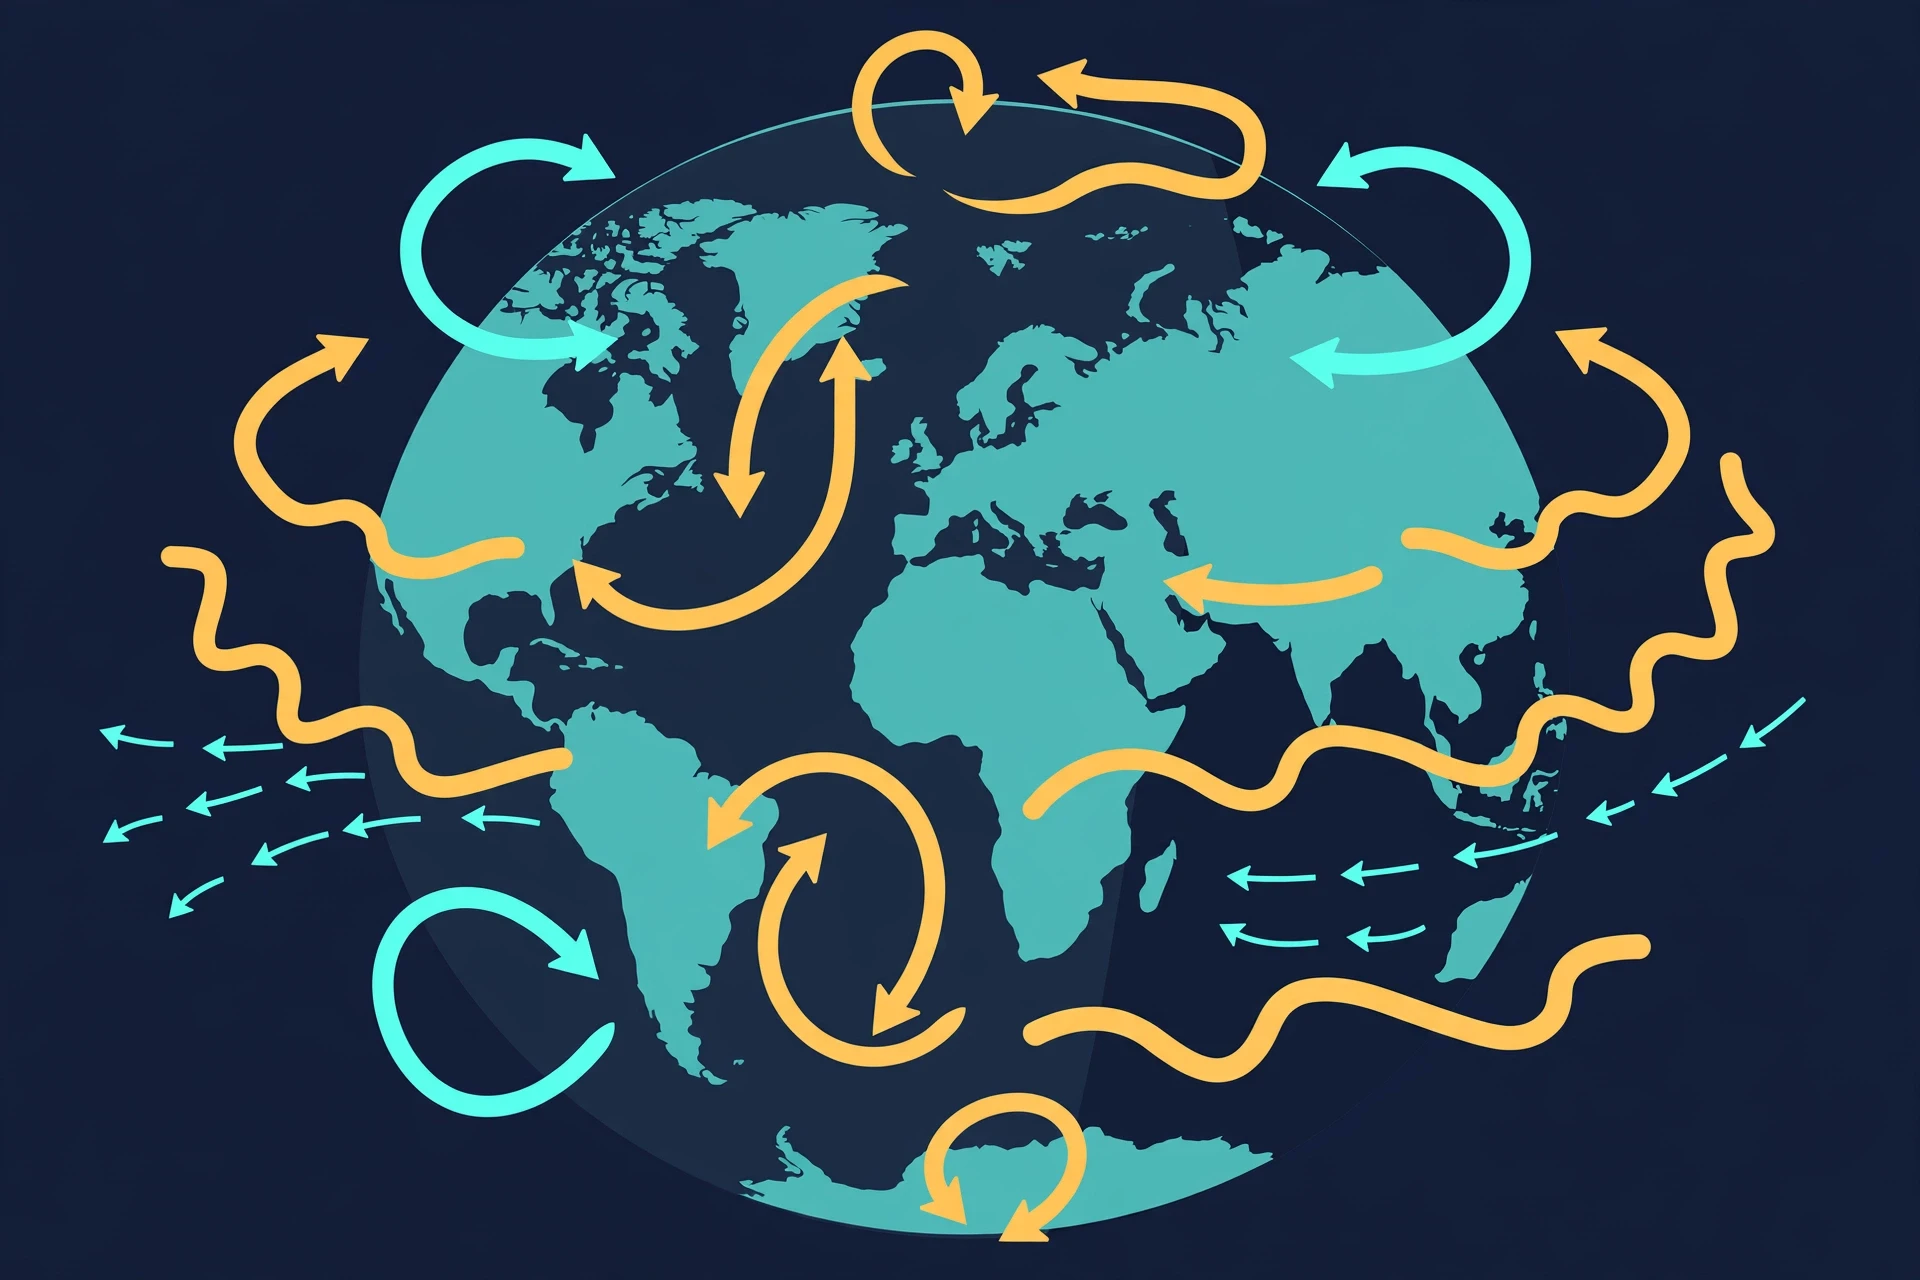
The rising and sinking of air, bent by the Coriolis effect, organises itself into three great circulation cells in each hemisphere. Near the equator, hot air rises and flows toward the poles, sinking around 30 degrees latitude: this is the Hadley cell, and its surface winds blowing back toward the equator are the trade winds that carried sailing ships across the oceans. The sinking air at 30 degrees is dry, which is why most of the world's great deserts — the Sahara, the Arabian, the Australian outback — sit near that latitude. In the middle latitudes, the Ferrel cell mixes air in a messier, stormier way, and near the poles the polar cell completes the pattern.
Between the cells run the great rivers of air: the trade winds near the equator, the prevailing westerlies in the mid-latitudes, and the polar easterlies near the poles. The westerlies are why weather in North America and Europe usually arrives from the west, and why a flight from New York to London is faster than the return. High above, at the boundaries between cells, race the jet streams — narrow bands of wind that can reach 300 kilometres per hour, steering storms like a river steering boats. When the jet stream dips south, cold air follows it; when it bulges north, warm air rides along. Much of the drama of mid-latitude weather is the jet stream wandering.
Wind belt | Latitude range | Surface wind direction | Character |
|---|---|---|---|
Trade winds | 0°–30° | East to west | Steady, warm, moist over oceans |
Prevailing westerlies | 30°–60° | West to east | Changeable, carries most mid-latitude storms |
Polar easterlies | 60°–90° | East to west | Cold, dry, weak |
Jet streams | Around 30° and 60° | West to east, high aloft | Fast, narrow, steers storms |
Table 1. The Earth's great wind belts. The pattern is set by uneven solar heating and bent into its familiar shape by the Coriolis effect.
3.4 Local winds: sea breezes, mountain winds, and city heat
The global pattern is only half the story. Local geography writes its own winds. A sea breeze by day and a land breeze by night. Valley winds that flow uphill as the Sun warms a slope and downhill as it cools after dark. The foehn, the chinook, and the mistral — warm, dry winds that spill over mountain ranges and can raise temperatures by ten degrees in an hour, drying laundry, melting snow, and, in the worst cases, fanning wildfires. Cities make their own weather too: concrete and asphalt store heat by day and release it at night, so a city can sit several degrees warmer than the countryside around it. That urban heat island changes local winds, triggers afternoon thunderstorms over the city, and makes heatwaves more dangerous for the people who live there.
4. Water in the Air: Clouds, Rain, and the Cycle That Feeds Them
4.1 Humidity, dew point, and why air can hold only so much
Warm air can hold more water vapour than cold air. That single fact runs most of the water story in meteorology. Humidity is a measure of how much water vapour the air actually holds; relative humidity is how close the air is to holding all it can at that temperature. When air cools to its dew point, it becomes saturated, and the extra water vapour has to go somewhere. It condenses — onto grass as dew, onto a cold glass as beads, and, high in the sky, onto tiny particles as cloud droplets.
This is why a hot, humid day feels so oppressive. Your body cools itself by sweating, and sweat cools you only when it evaporates. When the air is already near saturation, sweat sits on your skin and does nothing. The heat index — the "feels like" temperature — exists because humidity changes what heat does to a human body, not just what a thermometer says. It is also why a desert night can be bitterly cold: dry air holds little heat, and with no water vapour to trap it, the day's warmth escapes to space as soon as the Sun sets.
4.2 How a cloud is born
A cloud is not a thing so much as an event: water vapour condensing into droplets or ice crystals, usually because air has risen and cooled. Air rises in four main ways — heated from below, pushed up a mountain slope, lifted along a front, or converging into a low-pressure centre — and each way makes its own kind of cloud. For a cloud to form, the rising air also needs something to condense onto: microscopic particles called cloud condensation nuclei, specks of dust, salt, or smoke. Without them, even saturated air struggles to make droplets. That is one reason volcanic eruptions can change the weather far away: a volcano throws vast quantities of fine particles into the sky, and those particles seed clouds and scatter sunlight for months. The same sunlight that drives the weather also powers photosynthesis in plants, linking the sky's energy to the food web below it.
The droplets in a cloud are tiny — about a hundredth of a millimetre across — and they fall so slowly that rising air keeps them aloft. A cloud is, in a real sense, water that is falling and being pushed back up at the same time. Only when droplets collide and merge, growing a hundred times larger, do they become heavy enough to fall as rain. Or they freeze, grow into snowflakes, and melt on the way down. Every raindrop you have ever felt began as vapour, rose, cooled, condensed, collided, and fell — a journey through the water cycle that connects the ocean to the sky to the land and back again.
4.3 Reading clouds
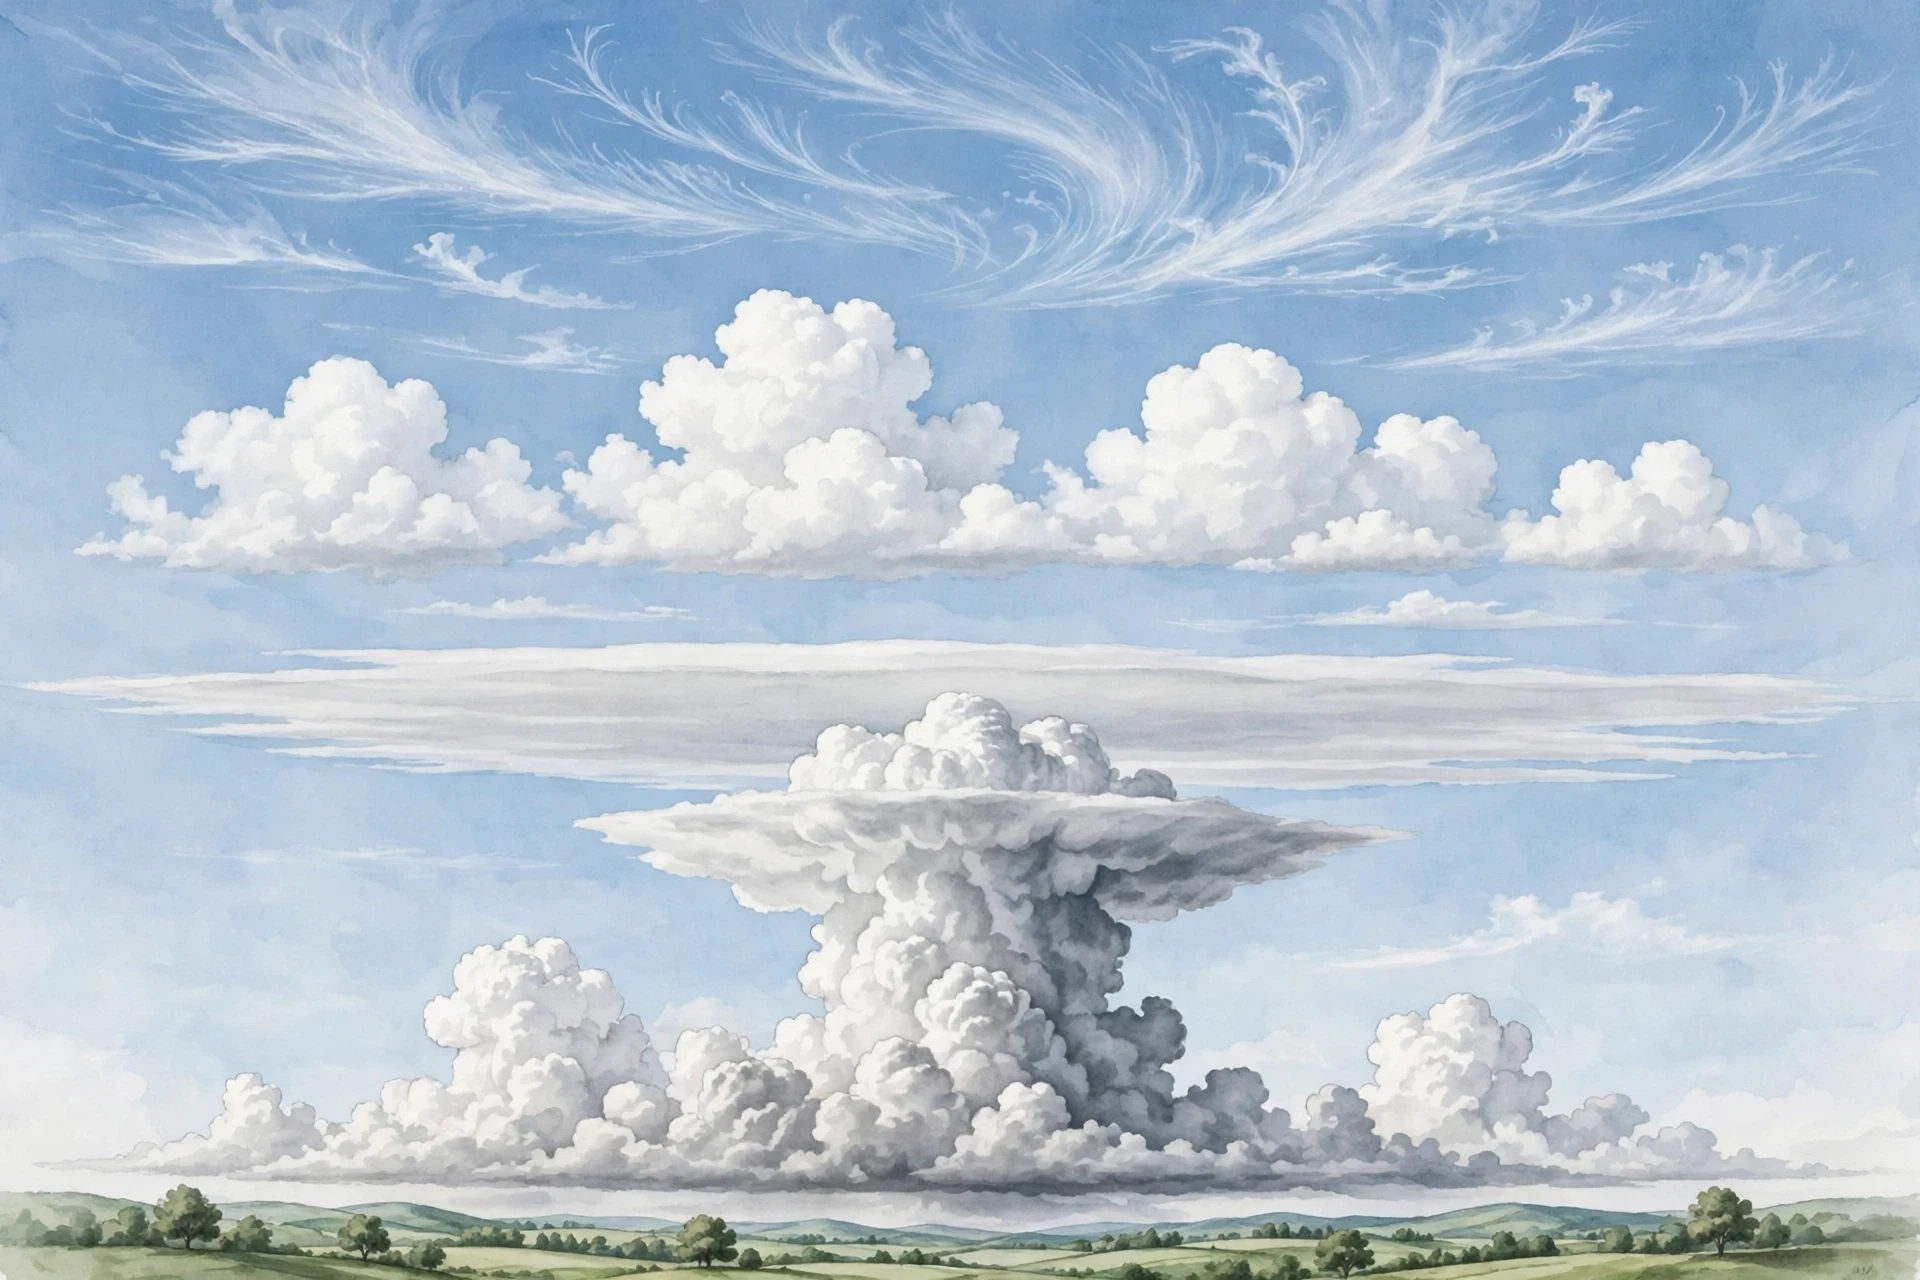
Clouds are the sky's handwriting, and learning to read them is the oldest forecasting skill there is. High, wispy cirrus clouds, made of ice crystals, often arrive a day ahead of a warm front. Puffy cumulus clouds on a summer afternoon mean rising air and fair weather — unless they keep growing, darkening at the base, and merging into towering cumulonimbus, the thunderstorm cloud, which can reach the top of the troposphere and bring lightning, hail, and downpours. Flat, grey stratus means a dull, drizzly day. Low, dark nimbostratus means steady rain is already falling or about to.
I still use cloud reading when I am away from a forecast. On a hiking trip years ago, I watched a line of small cumulus over a ridge thicken and darken through the morning, their tops turning hard and cauliflower-like, and I called the walk off an hour before the first thunder. My companions laughed at the caution until the rain arrived exactly where we would have been, on an exposed ridge with nowhere to shelter. The clouds had told the truth. They usually do, if you know the alphabet.
4.4 Rain, snow, hail, and fog
Precipitation takes many forms, and each one tells you something about the air it fell through. Rain is liquid all the way down. Snow forms when the whole column is below freezing, and the six-sided crystals grow into flakes as they fall. Sleet is rain that freezes on the way down; freezing rain is rain that stays liquid until it hits a cold surface and coats it in ice — one of the most dangerous winter hazards, because a millimetre of ice can bring down power lines. Hail is different again: it is made inside a thunderstorm, where a growing ice pellet is tossed up and down by violent updraughts, gathering a new layer of ice on each trip, until it is too heavy to stay up. The largest hailstones on record are the size of grapefruits, and they fall fast enough to smash windscreens and roofs.
Fog is a cloud that has come down to the ground. Radiation fog forms on clear, calm nights when the ground cools and chills the air above it to its dew point. Advection fog forms when warm, moist air moves over a cold surface, such as the sea. Fog is not dramatic, but it kills quietly: it closes airports, causes pile-ups on motorways, and hides the world a few metres ahead. A meteorologist's job is to care about the undramatic hazards as much as the spectacular ones.
"The atmosphere is a restless ocean, and we live at its bottom, watching its weather as fish might watch the waves above them — mostly unaware, until the surface breaks." — a thought I return to whenever someone asks why the sky deserves a science of its own.
5. Air Masses and Fronts: Where Weather Is Made
5.1 Air masses: the sky's travelling nations
A large body of air that sits over one region for days takes on that region's character. Air over the Gulf of Mexico becomes warm and humid. Air over northern Canada becomes cold and dry. Air over the Sahara becomes hot and dusty. These are air masses, and they can be thousands of kilometres across. When they start to move, they carry their weather with them, the way a travelling nation carries its climate in its luggage.
Meteorologists name air masses by where they formed and how warm they are: maritime tropical, continental polar, maritime polar, continental tropical, and a few more. The names sound like stamp collecting, but they are practical. If a maritime tropical air mass is heading for your town in July, expect heat and thunderstorms. If a continental polar air mass is coming in January, expect a sharp, dry cold. Much of day-to-day forecasting is tracking these great bodies of air and asking where they will meet.
5.2 Fronts: the battle lines
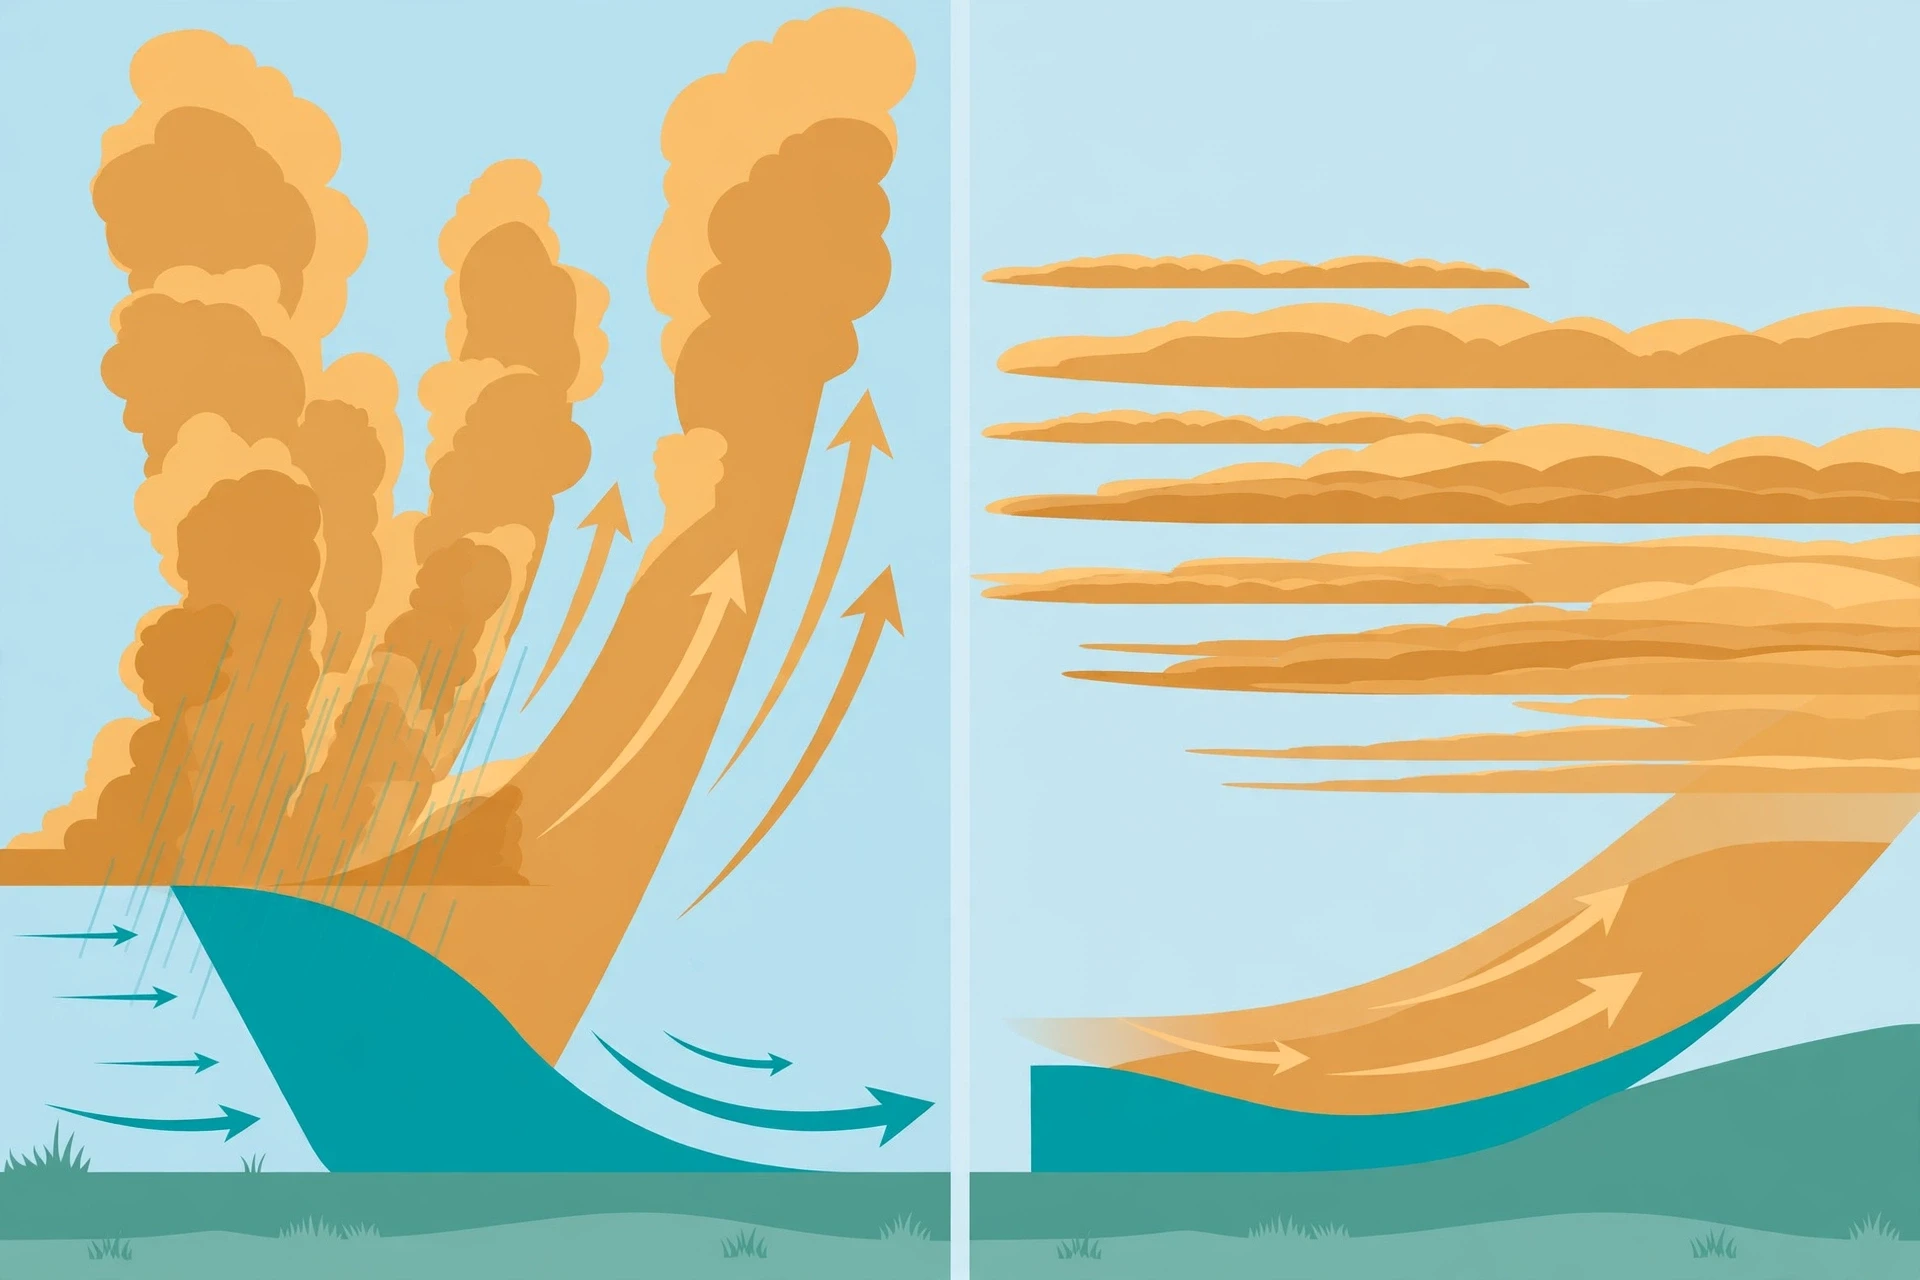
When two air masses meet, they do not mix easily. The boundary between them is a front, and fronts are where much of our weather is made. A cold front is cold, dense air pushing under warm air and shoving it upward, fast. The warm air rises sharply, cools, and condenses into a narrow band of heavy showers and thunderstorms, followed by cooler, clearer air. A cold front can pass in an hour, and you can feel it: the wind shifts, the temperature drops, the rain arrives in a rush and then stops.
A warm front is warm air sliding gently up over a retreating cold air mass. The slope is shallow, so the lift is slow and wide. Clouds arrive in sequence — high cirrus first, then thickening altostratus, then low stratus — and steady rain can fall for hours before the front itself passes and the air turns warmer and muggier. An occluded front forms when a cold front catches up with a warm front and lifts the warm air clean off the ground. A stationary front is a boundary that stalls, with rain falling along it for days.
Cloud types themselves give away a front's approach: cirrus far ahead of a warm front, then thickening layers as it nears, and cumulus or cumulonimbus as a cold front arrives. I have watched that sequence play out over a weekend at the coast — the high, feathered clouds on Friday, the grey ceiling on Saturday, the rain, and then the sharp clear-out on Sunday as the cold front passed and the wind swung round to the north. The front had announced itself a full day before it arrived. The sky does not ambush you if you know how to listen.
5.3 Highs and lows: the pressure map
On a weather map, the big players are high-pressure systems (anticyclones) and low-pressure systems (cyclones). In a high, air sinks, warms, and dries out, so skies clear and winds are light. A summer high can mean a week of blue sky — and, if it stalls, a heatwave. In a low, air rises, cools, and condenses, so clouds thicken and rain falls. Mid-latitude lows, the great swirling systems that cross the Atlantic and sweep over continents, are the main weather-makers for much of the world. They are born where cold polar air meets warm tropical air, grow by feeding on the temperature contrast, and die when that contrast is used up.
Reading a surface weather map is a skill anyone can learn. Find the H and the L. Remember that air flows clockwise around a high and counterclockwise around a low in the Northern Hemisphere, and the opposite in the Southern. Look for the fronts trailing from the low, and the isobars — lines of equal pressure — packed tightly where the wind will be strong. The map is not decoration. It is a snapshot of the atmosphere's intentions.
6. Storms: The Atmosphere Letting Off Steam
6.1 Thunderstorms: the basic storm
A thunderstorm needs three ingredients: warm, moist air near the ground, an unstable atmosphere in which that air keeps rising once it starts, and a trigger — a front, a mountain, a sea breeze, or simply the heat of the afternoon — to give it the first push. The warm air rises in a tower, cooling as it goes, condensing into a cumulus cloud that grows taller and taller. Inside, updraughts and downdraughts race past each other. Ice crystals collide, separate electric charge, and build up a voltage difference between the cloud and the ground until the air itself breaks down and a bolt of lightning jumps the gap.
Lightning is not a side effect of a thunderstorm. It is a central part of how the storm balances its electrical books. A single bolt can heat the air around it to about 30,000 degrees Celsius — five times hotter than the surface of the Sun — and the thunder you hear is that superheated air expanding faster than sound. Count the seconds between the flash and the thunder, divide by three, and you have the distance in kilometres. That is not folklore; it is the speed of sound doing arithmetic for you.
That link between lightning and electricity is worth pausing on. The same physics that makes a spark jump in a classroom demonstration makes a bolt jump five kilometres from a cloud to a field. Our understanding of electricity — charge, voltage, conduction — is the same understanding that explains why a metal rod on a roof can protect a house, and why standing under a tree in a storm is one of the worst places to be. Benjamin Franklin's kite experiment in 1752 is often told as a cute story, but it was a serious piece of science: it proved that lightning is electricity, and it led, within a few years, to the lightning rod, one of the first technologies to save lives by understanding the sky.
Most thunderstorms live for less than an hour. They build, they rain themselves out, and their own cold downdraught cuts off the warm air feeding them. The exception is the supercell, a rotating thunderstorm with a single, persistent updraught that can live for hours and travel for hundreds of kilometres. Supercells make the largest hail, the strongest winds, and most of the violent tornadoes. I have stood under one and felt the difference: the air goes still, the light turns strange and yellow-green, and the cloud base begins to rotate, slow and deliberate, like something deciding what to do next.
6.2 Tornadoes: the narrowest, fastest wind on Earth
A tornado is a violently rotating column of air, usually born inside a supercell, that reaches from a cloud base to the ground. Its winds can exceed 300 kilometres per hour, and in the most violent cases, more. The damage a tornado does comes not just from wind speed but from the pressure drop at its centre and the debris it throws — a straw driven into a tree trunk, a car lifted and set down a street away. The Enhanced Fujita scale, from EF0 to EF5, rates tornadoes by the damage they cause, because measuring the wind directly inside a tornado is almost impossible.
Tornado forecasting has improved enormously. The National Oceanic and Atmospheric Administration's Storm Prediction Center issues daily outlooks for severe thunderstorms, and when conditions turn favourable, forecasters issue watches that typically last four to six hours, followed by warnings when a tornado is spotted or detected on radar. The average warning lead time is now around thirteen minutes — not long, but long enough to get to a basement or an interior room, and that margin is measured in lives. The research programme behind those gains, including work on Warn-on-Forecast, aims to push lead times further by feeding live radar data into storm-scale computer models.
6.3 Hurricanes, typhoons, and cyclones: the ocean's engine
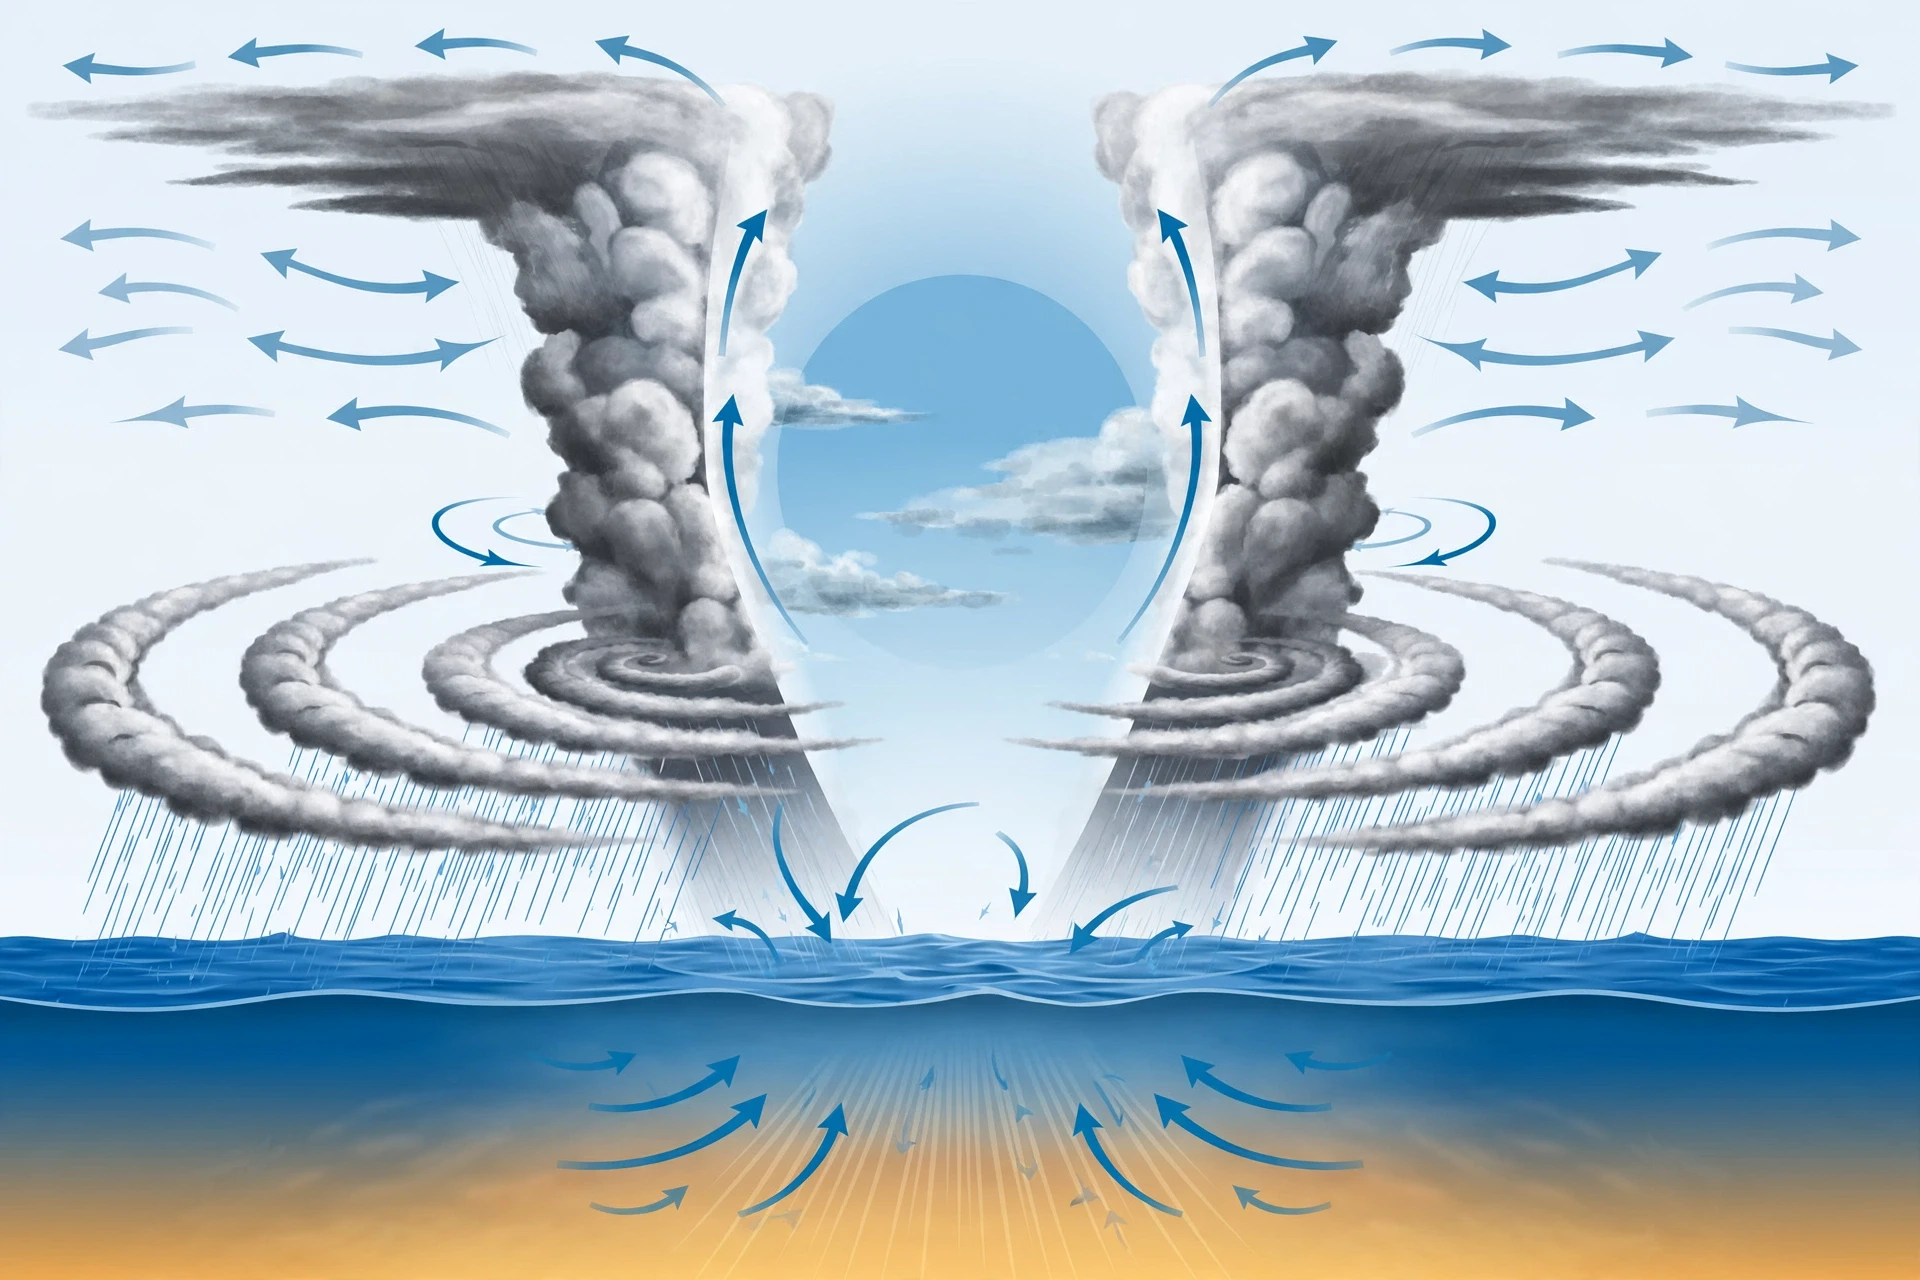
A tropical cyclone — called a hurricane in the Atlantic, a typhoon in the western Pacific, and a cyclone in the Indian Ocean — is a different kind of machine. It is a heat engine powered by warm ocean water. When the sea surface is above about 26.5 degrees Celsius, warm, moist air rises from the ocean, condenses into towering clouds, and releases latent heat. That heat warms the core, lowers the pressure, and pulls in more air, which rises and releases more heat. The cycle feeds itself, and the Coriolis effect bends the inflow into a great spiral, hundreds of kilometres wide, with a calm eye at the centre.
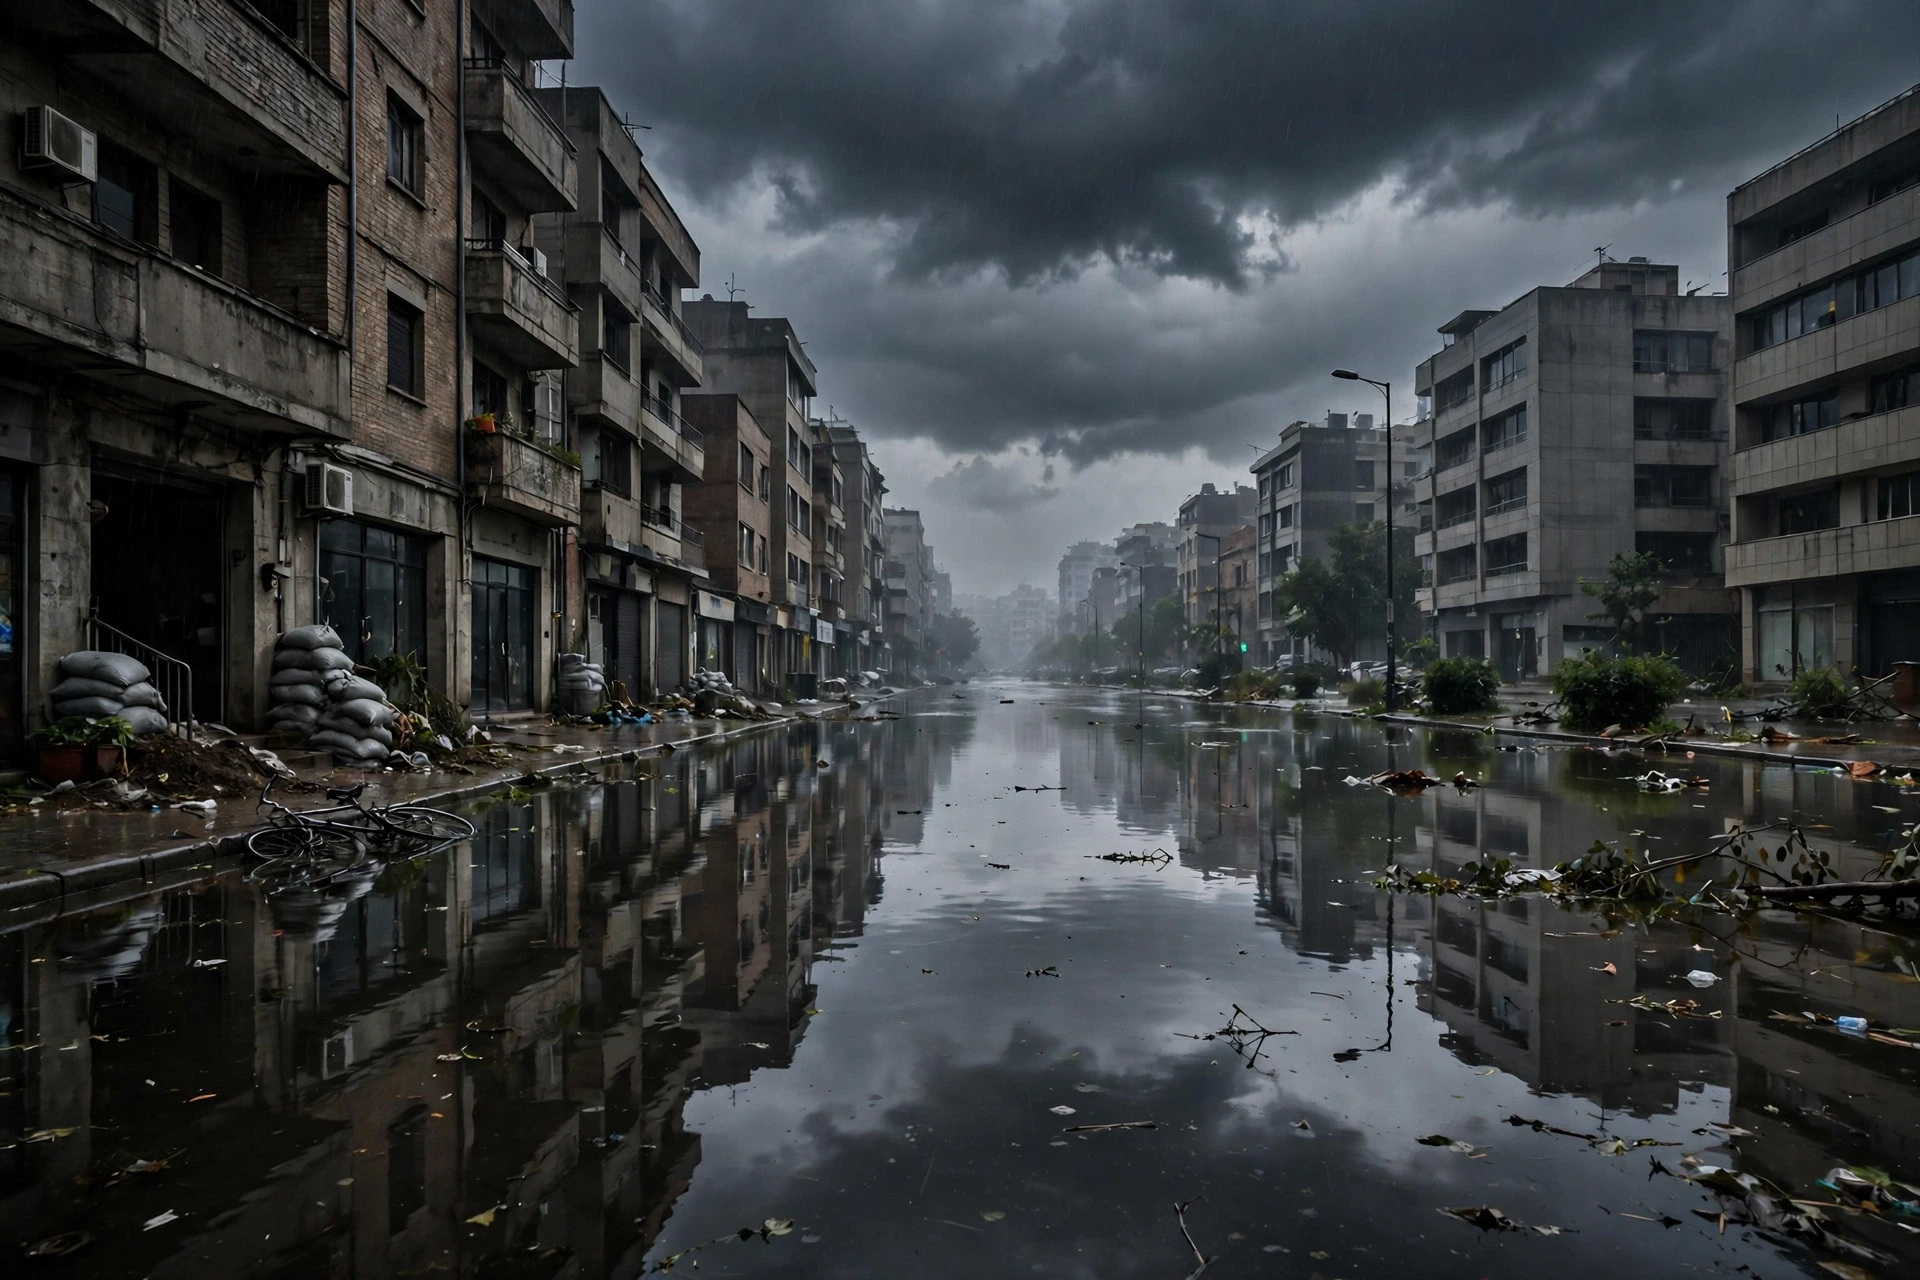
A hurricane's damage comes in three forms, and wind is often the least of them. The storm surge — seawater pushed ashore by the wind and the low pressure — is the deadliest, flooding coastal towns under metres of water. The rain can fall in staggering amounts, hundreds of millimetres in a day, causing inland floods far from the coast. And the wind tears roofs, snaps trees, and knocks out power for days or weeks. The Saffir-Simpson scale rates hurricanes from Category 1 to Category 5 by sustained wind speed, but the scale does not capture surge or rainfall, which is why a "weak" hurricane can still be catastrophic if it stalls over a city.
I will never forget watching a hurricane forecast cone narrow, day by day, toward a coastline where friends lived. The cone is not a prediction of where the storm will go; it is a picture of uncertainty, drawn from the errors of past forecasts. Two-thirds of the time, the centre stays inside it. One-third of the time, it does not. That is honest forecasting, and it is why emergency managers evacuate a whole coastline for a storm that might, in the end, turn away. The cost of a false alarm is a wasted day. The cost of a missed evacuation is measured in funerals.
6.4 Blizzards, heatwaves, and the quiet extremes
Not all dangerous weather is violent. A blizzard is defined not by how much snow falls but by wind — sustained winds or frequent gusts above about 56 kilometres per hour, with blowing snow cutting visibility below 400 metres for at least three hours. A blizzard can bury roads, strand drivers, and freeze exposed skin in minutes, even when the snowfall itself is modest. A heatwave is a long spell of unusually hot weather, and it is the deadliest weather hazard in many countries, because it kills quietly, indoors, among the elderly and the ill, without a single dramatic photograph.
Drought is the slowest extreme of all: weeks or months of below-normal rain, draining reservoirs, withering crops, and drying forests until a single spark can start a wildfire. Floods are its opposite: too much water, too fast, overwhelming rivers and drains. Both are weather events with long tails, and both are shaped by the same large-scale patterns — a high-pressure ridge that will not move, a jet stream locked in place — that make a heatwave last a week instead of a day. The atmosphere's extremes are not separate from its everyday workings. They are its everyday workings, pushed to the edge.
Storm | Main energy source | Typical size | Main hazard |
|---|---|---|---|
Thunderstorm | Warm, moist surface air | 10–20 km | Lightning, hail, flash flooding |
Tornado | Rotating supercell updraught | Under 1 km wide | Extreme wind, debris |
Hurricane | Warm ocean water | 300–1,000 km | Storm surge, rain, wind |
Blizzard | Cold air + strong wind | Hundreds of km | Wind, whiteout, extreme cold |
Heatwave | Stalled high pressure | Thousands of km | Heat illness, drought, fire |
Table 2. The main storm types compared. Each one is the same atmosphere, fed by a different source of energy and shaped by a different scale.
7. Watching the Sky: Instruments, Satellites, and Radar
7.1 The ground network
Modern forecasting begins with measurement, and the measurement network is one of the largest scientific instruments ever built. Tens of thousands of surface weather stations report temperature, humidity, pressure, wind, and precipitation every hour, many of them automated. Weather balloons — radiosondes — are launched twice a day from hundreds of sites around the world, rising through the atmosphere and radioing back a vertical profile of temperature, humidity, and wind until they burst, usually around 30 kilometres up. Ships, aircraft, and buoys add millions more observations over the oceans, where there are no stations at all.
Each of those measurements is small. Together, they are the initial conditions of the forecast: the atmosphere's state, right now, in numbers. A forecast is only as good as those numbers, which is why meteorologists care so much about a balloon launched from a remote island or a temperature reading from a ship in the middle of the Pacific. A gap in the observations is a gap in the forecast, and the atmosphere does not politely avoid the gaps.
7.2 Radar: seeing rain
Weather radar works by sending out pulses of radio waves and listening for the echo. Raindrops, snowflakes, and hailstones reflect the pulses back, and the strength of the echo tells forecasters how heavy the precipitation is, while the timing tells them how far away it is. Doppler radar goes further: it measures the shift in the returning waves, which reveals whether the rain is moving toward the radar or away from it. That is how forecasters can see rotation inside a thunderstorm — the signature of a possible tornado — before the tornado ever touches the ground.
The United States operates a network of 159 Doppler radar stations, scanning the sky every few minutes, and similar networks cover Europe, Japan, Australia, and much of the rest of the world. Radar cannot see through mountains, and it cannot see what is happening above the ground very far away, because the beam rises with distance. But for short-term warnings — a flash flood, a hailstorm, a tornado — radar is the forecaster's most important tool, and the reason warning lead times have grown from minutes to tens of minutes.
7.3 Satellites: the view from above
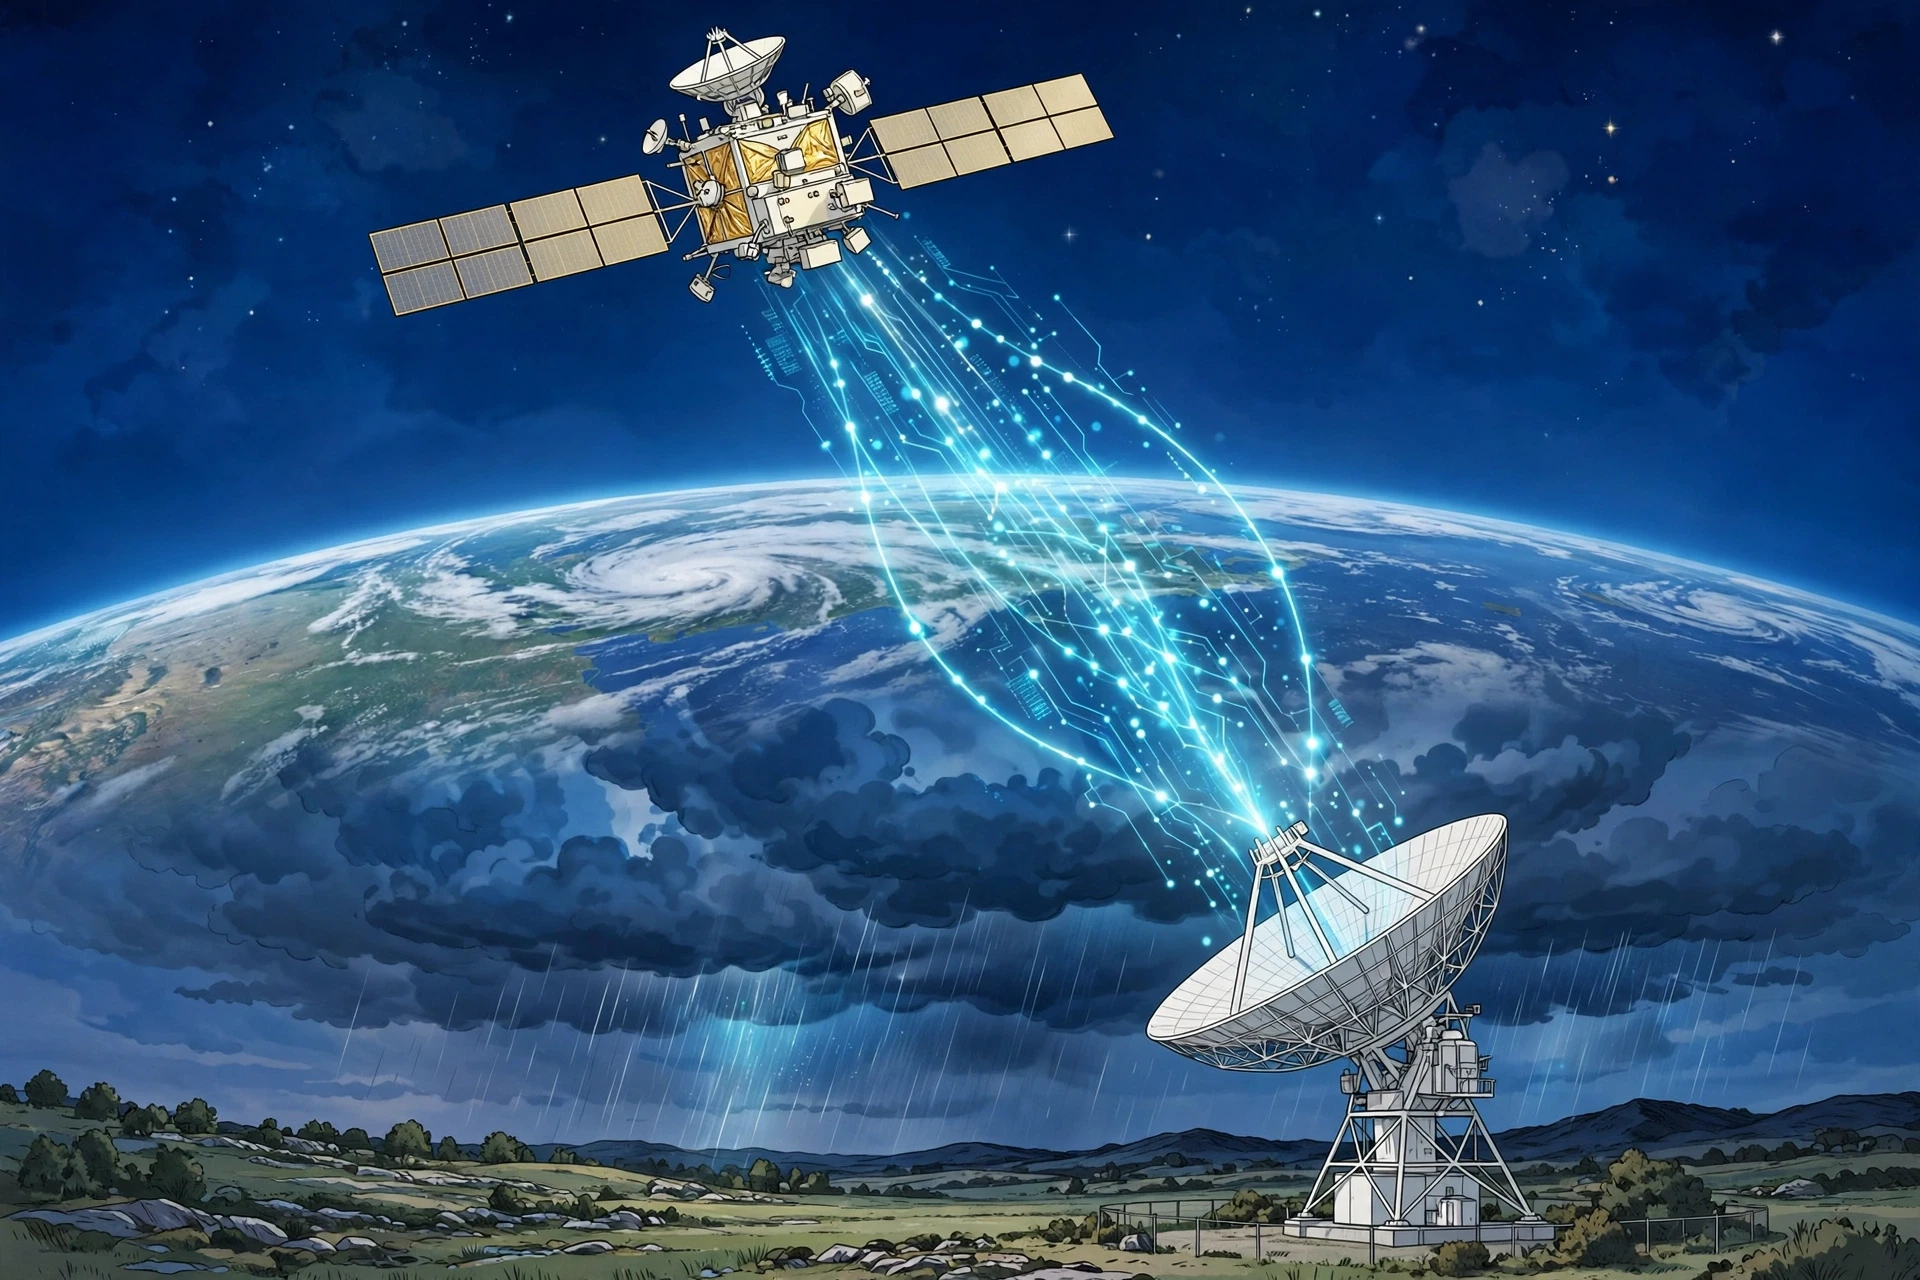
Weather satellites changed meteorology more than any other invention. Geostationary satellites hover over one spot on the equator, watching the same hemisphere continuously, taking a new picture every few minutes. Polar-orbiting satellites circle the planet, sweeping up detailed measurements of temperature, humidity, and wind through the depth of the atmosphere. Together, they show what no ground network can: a hurricane forming over an empty ocean, a dust storm crossing a continent, a front stretching across a whole sea.
NASA's Earth Science Division operates more than twenty satellites in orbit, measuring the oceans, land, ice, and atmosphere, and making the data freely available. Those measurements do more than feed forecasts. They track how the planet's systems connect — how ocean temperatures shape rainfall, how melting ice changes sea level, how a warming atmosphere holds more water vapour and makes heavy rain more likely. NASA describes its Earth science mission as understanding how our planet works, for the benefit of humanity, and the weather satellites are the eyes of that mission.
I remember the first time I watched a satellite loop of a hurricane in real time: the spiral turning, slow and vast, the eye winking open and shut, the whole storm moving with a patience that made its power feel even greater. A photograph from the ground shows a storm. A satellite loop shows a planet breathing.
8. How a Forecast Is Actually Made
8.1 From observations to equations
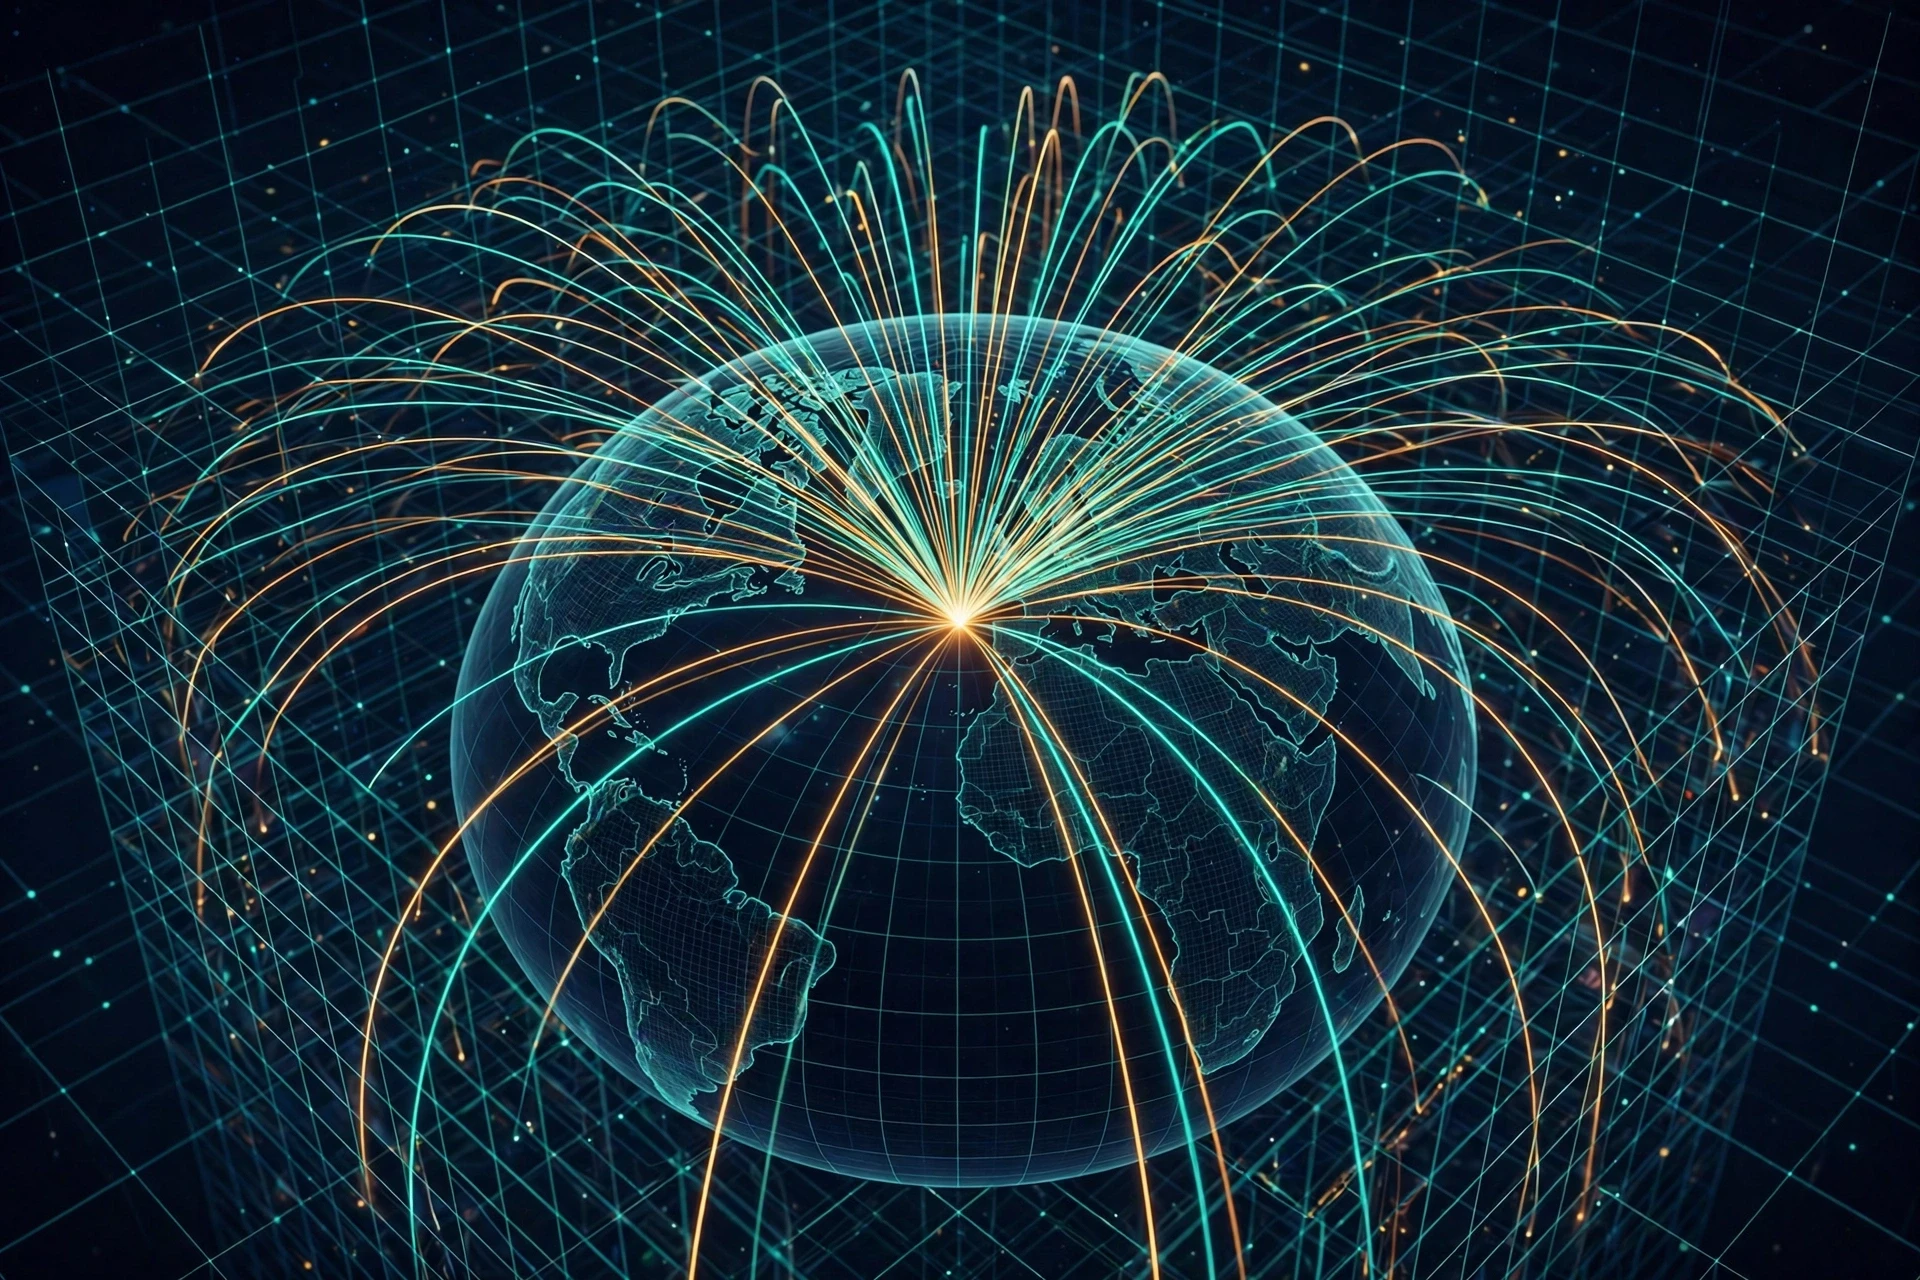
The heart of modern forecasting is numerical weather prediction: using supercomputers to solve the equations that describe the atmosphere. The equations are the laws of physics — conservation of mass, momentum, and energy, plus the ideal gas law — applied to a three-dimensional grid laid over the Earth. Each grid cell holds a temperature, a pressure, a humidity, and a wind, and the computer steps the whole grid forward in time, a few minutes at a time, calculating how each cell changes and how it affects its neighbours.
The observations from section 7 are the starting point. They are fed into the model in a process called data assimilation, which blends the measurements with the model's previous forecast to produce the best possible picture of the atmosphere right now. Then the model runs forward: six hours, twelve hours, three days, ten days. The result is a forecast — not a single number, but a full, moving, three-dimensional picture of the atmosphere's future, from which a forecaster can read off the temperature in your town, the wind on a mountain pass, or the track of a hurricane.
The scale of the computing is hard to overstate. NOAA's weather models solve trillions of calculations per run; the Global Forecast System needs more than ten quadrillion calculations for a complete run, and it runs four times a day. The European Centre's model runs on a grid of about nine kilometres. Finer grids mean finer detail — a valley, a coastline, a single thunderstorm — but they also mean vastly more computing, because halving the grid spacing multiplies the work many times over.
8.2 Ensembles: forecasting the uncertainty
No observation is perfect, and no model is perfect, so a single forecast can be misleadingly confident. The answer is ensemble forecasting: run the same model many times, each time with slightly different starting conditions or slightly different physics, and look at the spread of the results. If all fifty runs agree that it will rain tomorrow, the forecaster can be confident. If half say rain and half say sun, the honest forecast is a probability: a 50% chance of rain.
That probability is not a failure of forecasting. It is forecasting done properly. A 30% chance of rain does not mean the forecaster is unsure whether it will rain a little; it means that in three out of ten similar situations, it rained. A good forecaster tells you the odds, and a good forecast user plans around them. The hurricane cone, the rain probability, the temperature range — all of these are the ensemble speaking, and they are more useful than a single, confident number that hides how much is still unknown.
8.3 The forecaster's job: human plus machine
A common question is whether computers will replace human forecasters. The honest answer is that they already have, for the routine parts — and they have not, for the parts that matter most. The model produces the first draft. The forecaster reads it against experience: this model runs too warm in this valley, that one overdoes rain on this coast, the radar shows a storm the model missed. The forecaster adjusts, writes the warning, and decides what to tell the public and when.
I watched that partnership work during a winter storm that the models had split on: half said snow, half said rain, and the difference was a single degree at the surface. The forecaster on duty looked at the latest balloon sounding, saw the cold layer was deeper than the models thought, and called for snow. It snowed. The model had the physics. The forecaster had the sounding, the local knowledge, and the willingness to disagree with the machine. That is the job, and it is not going away.
8.4 Why forecasts get worse with time — and how far they reach
Forecasts are good for about four to five days, useful for about a week, and increasingly uncertain beyond that. The reason is chaos. The atmosphere is a chaotic system, in which tiny differences in the starting state grow with time. Edward Lorenz, the meteorologist who discovered this in the 1960s, called it the butterfly effect: a small change in one place can, in principle, change the weather somewhere else days later. In practice, the limit is not butterflies. It is the gaps in our observations and the approximations in our models, and both are improving.
The improvement is real and measurable. A five-day forecast today is about as accurate as a three-day forecast was twenty years ago. Ten-day forecasts, once little better than guessing the climate average, now carry real skill for large-scale patterns. Seasonal outlooks — whether the next three months will be warmer or wetter than usual — are possible because slow patterns like El Niño and La Niña, the warming and cooling of the tropical Pacific, tilt the odds for months at a time. The forecast will never be perfect. The atmosphere will not allow it. But it keeps getting better, year by year, and the gains are measured in warnings issued, flights rerouted, and lives saved.
9. Weather in a Changing Climate — and the Newest Research
9.1 A warmer atmosphere holds more water
Warm air holds about 7% more water vapour for every degree Celsius of warming. That is a simple physical rule — the Clausius-Clapeyron relation — with large consequences. A warmer atmosphere can load more water into a storm and drop it as heavier rain. It also evaporates water faster from soil and reservoirs, deepening droughts between the rains. The result is a pattern many regions are already seeing: longer dry spells, punctuated by heavier downpours. The total amount of rain may not change much. The way it arrives does, and the way it arrives is what floods a town or empties a reservoir — and what reshapes the habitats that biodiversity depends on.
This is also why the distinction between weather and climate matters for the future. A single heavy rainfall is weather. A shift in how often heavy rainfalls happen, measured over decades, is climate. Meteorologists and climatologists work on the same atmosphere with different time horizons, and the bridge between them is the long, careful record of observations — the rain gauges, the thermometers, the satellite record — that lets us tell a trend from a fluke.
9.2 Extreme weather and the questions researchers are asking
Are hurricanes getting stronger? Are heatwaves getting longer? Are tornadoes shifting where they form? These are live research questions, and the honest answers are nuanced. There is strong evidence that heatwaves are becoming hotter and longer in many regions, and that heavy rainfall events are becoming more intense. The evidence for changes in hurricane frequency is weaker, but there is growing evidence that the strongest storms are getting stronger and that they are producing more rain. Tornado records are harder to read, because better detection has changed what gets counted, but there are signs of shifts in where tornadoes are most common in the United States.
Researchers are also working on the puzzles that have resisted answers for decades: why some thunderstorms become supercells and others do not, how exactly a tornado forms inside a storm, and how far ahead a single storm can be predicted at all. The answers are coming from new tools — drones that fly into storms, phased-array radar that scans the sky in seconds instead of minutes, and models that resolve individual clouds instead of averaging them away.
9.3 Artificial intelligence enters the forecast office
The newest change in meteorology is the arrival of machine-learning weather models. Trained on decades of past weather, these models can produce a ten-day global forecast in minutes on a single computer, where a traditional model needs a supercomputer and hours. In some tests, they match or beat traditional models on large-scale patterns. They are not replacing physics-based models — they learned from them, and they still struggle with the extremes and the fine detail — but they are changing the economics of forecasting, and they are making good forecasts available in places that could never afford a supercomputer.
My own view is that the most interesting use of artificial intelligence in meteorology is not the forecast itself but the warning: translating a forecast into a decision. Which roads will flood? Which hospitals will lose power? Which neighbourhoods need to evacuate first? Those questions need the forecast, the geography, and the human geography together, and that is where the next decade of progress will be won. The forecast tells you what the sky will do. The warning tells you what to do about it.
10. Common Misconceptions About Meteorology — Corrected
Most people carry a handful of wrong ideas about the weather, and most of them are reasonable. They come from phrases we hear, pictures we see, and the way our own bodies mislead us. Here are the ones I correct most often.
"Lightning never strikes the same place twice." It does, often. Tall buildings and towers are struck dozens of times a year. The Empire State Building is struck about twenty-five times a year. Lightning goes where the charge builds up, and a tall, exposed object builds it up again and again.
"A 30% chance of rain means it will rain 30% of the time, or over 30% of the area." Neither, quite. It means that in 30% of similar forecast situations, rain fell at a given point. It is a probability, not a fraction of the day or the map, and treating it as one leads to bad decisions.
"The Coriolis effect decides which way your bathwater swirls." It does not. The effect is far too weak at that scale. The shape of the basin, the tap, and the last movement of the water decide the swirl. The Coriolis effect needs hundreds of kilometres and many hours to show its hand.
"A cold winter disproves global warming." It does not. Weather is a single day in a single place. Climate is the pattern over decades and across the planet. A cold snap can happen in a warming climate, and it does, regularly — just as a hot day can happen in a cooling one.
"Forecasters are just guessing." They are not. A forecast is a calculation from physics, fed by millions of observations and run on supercomputers, then adjusted by a trained human. It is uncertain, because the atmosphere is chaotic, but it is not a guess. A five-day forecast today is more accurate than a three-day forecast was a generation ago, and the improvement is measured, published, and steady.
"Heat lightning is a different kind of lightning." It is not. "Heat lightning" is ordinary lightning from a distant thunderstorm, too far away for the thunder to reach you. The flash is real. The silence is distance.
"Tornadoes only happen in Tornado Alley." They happen on every continent except Antarctica. The central United States has the most, because its geography — warm, moist air from the Gulf meeting cold, dry air from the north, with the Rockies shaping the winds — is unusually favourable. But tornadoes have struck Britain, Bangladesh, Argentina, and many other places.
Conclusion: Learning to Read the Sky
Meteorology begins with a simple observation: the Sun heats the Earth unevenly, and the atmosphere spends its life trying to even things out. From that one fact come the winds, the clouds, the fronts, and the storms. Warm air rises, cool air sinks, pressure differences drive the wind, and the spinning Earth bends it all into the great patterns we see on a satellite image. Water rides along, condensing into clouds, falling as rain, and returning to the sea, carrying heat with it at every step. And when we measure that restless ocean of air carefully enough, and run its physics forward on a computer, we can say — with honest uncertainty — what it will do tomorrow, and the day after, and, with luck and skill, the day after that.
The next time you check a forecast, remember what stands behind the little sun or cloud icon on your screen: balloons rising twice a day from hundreds of stations, satellites watching the whole planet, radar dishes sweeping the sky every few minutes, and supercomputers solving the equations of the atmosphere trillions of times over. Behind that, there is a forecaster, reading the output against a lifetime of storms, deciding what to tell you and how plainly to say it. And above it all, there is the sky itself, running its experiment again, as it has every day for four billion years.
Go outside and look up. A line of cumulus building over a ridge. A halo around the Moon. A wind that has shifted and cooled. The sky is talking. Meteorology is the language it speaks, and it is a language anyone can learn.
Frequently Asked Questions
What is meteorology?
Meteorology is the scientific study of the atmosphere and the weather it produces. It covers temperature, air pressure, humidity, wind, clouds, and precipitation, and how they change over hours and days, using physics, chemistry, mathematics, and computing to understand and forecast the weather.
What is the difference between weather and climate?
Weather is the state of the atmosphere at a particular place and time, such as today's temperature and rain. Climate is the long-term average pattern of that weather, usually over thirty years, such as how hot summers usually are in a region. Weather is what you get; climate is what you expect.
How do meteorologists forecast the weather?
Meteorologists collect observations from surface stations, weather balloons, aircraft, ships, radar, and satellites, feed them into numerical weather prediction models that solve the equations of atmospheric physics on supercomputers, and then adjust the model output using their experience and local knowledge.
How accurate are weather forecasts?
A forecast for tomorrow is usually very accurate, a five-day forecast is good, and a ten-day forecast is useful for large-scale patterns but uncertain in detail. Accuracy falls with time because the atmosphere is chaotic, so small errors in the starting measurements grow. Five-day forecasts today are about as accurate as three-day forecasts were twenty years ago.
What causes wind?
Wind is caused by differences in air pressure. Air flows from high pressure toward low pressure, and the steeper the difference, the stronger the wind. The Sun creates the temperature differences that create the pressure differences, and the Earth's rotation bends the flow into the patterns we see on weather maps.
Why does it rain?
Rain falls when water vapour in rising air cools and condenses into cloud droplets, which collide and merge until they are heavy enough to fall. Air rises because it is heated, pushed up a mountain, lifted along a front, or drawn into a low-pressure system. If the air is cold enough, the precipitation falls as snow instead.
What is a weather front?
A weather front is the boundary between two air masses with different temperatures and humidity. A cold front is cold air pushing under warm air, bringing sharp showers and storms. A warm front is warm air sliding over cold air, bringing longer, steadier rain. Fronts are where much of our day-to-day weather is made.
How do hurricanes form?
Hurricanes form over warm ocean water, above about 26.5 degrees Celsius, when warm, moist air rises, condenses, and releases heat, lowering the pressure and pulling in more air. The Coriolis effect bends the inflow into a spiral. They need warm water, moist air, and low wind shear, and they weaken quickly over land or cool water.
What is the Coriolis effect?
The Coriolis effect is the apparent deflection of moving air caused by the Earth's rotation: to the right in the Northern Hemisphere and to the left in the Southern Hemisphere. It makes storms spiral, bends winds around high and low pressure systems, and shapes the global wind belts. It is too weak to affect a draining bathtub.
Why is the sky blue, and what does it have to do with weather?
The sky is blue because air molecules scatter short blue wavelengths of sunlight more than other colours, a process called Rayleigh scattering. It matters to weather because the same scattering and absorption shape how sunlight heats the atmosphere, and because the colour and clarity of the sky — hazy, milky, or deep blue — tell an experienced observer about humidity, dust, and approaching weather.
Sources / Further Reading
World Meteorological Organization — Weather: https://wmo.int/topics/weather
National Weather Service — About the NWS: https://www.weather.gov/about/
NASA — Earth Science: https://science.nasa.gov/earth-science/