
In the winter of 1997, during a powerful El Niño, rain fell on the Atacama Desert. That sentence sounds unremarkable until you know the Atacama is one of the driest places on Earth, a strip of land in northern Chile where some weather stations have never recorded rain at all. Flowers bloomed across ground that had been bare for years. Rivers that existed only as dry scars filled with water. People who had lived their whole lives in that desert walked outside and watched rain fall from a sky that almost never gives it.
Thousands of kilometres away, in Indonesia and Australia, the same months brought the opposite story. Forests dried out. Rivers shrank. Fires burned across landscapes that are normally soaked by afternoon rain. Farmers watched crops fail in fields that had fed their families for generations.
Both stories had the same cause, and it was not a local one. It was the Pacific Ocean, thousands of kilometres wide, quietly changing its temperature. That is the power of el niño and its cool twin, La Niña. A shift of a few degrees in a patch of ocean near the equator can redraw the weather map of the entire planet.
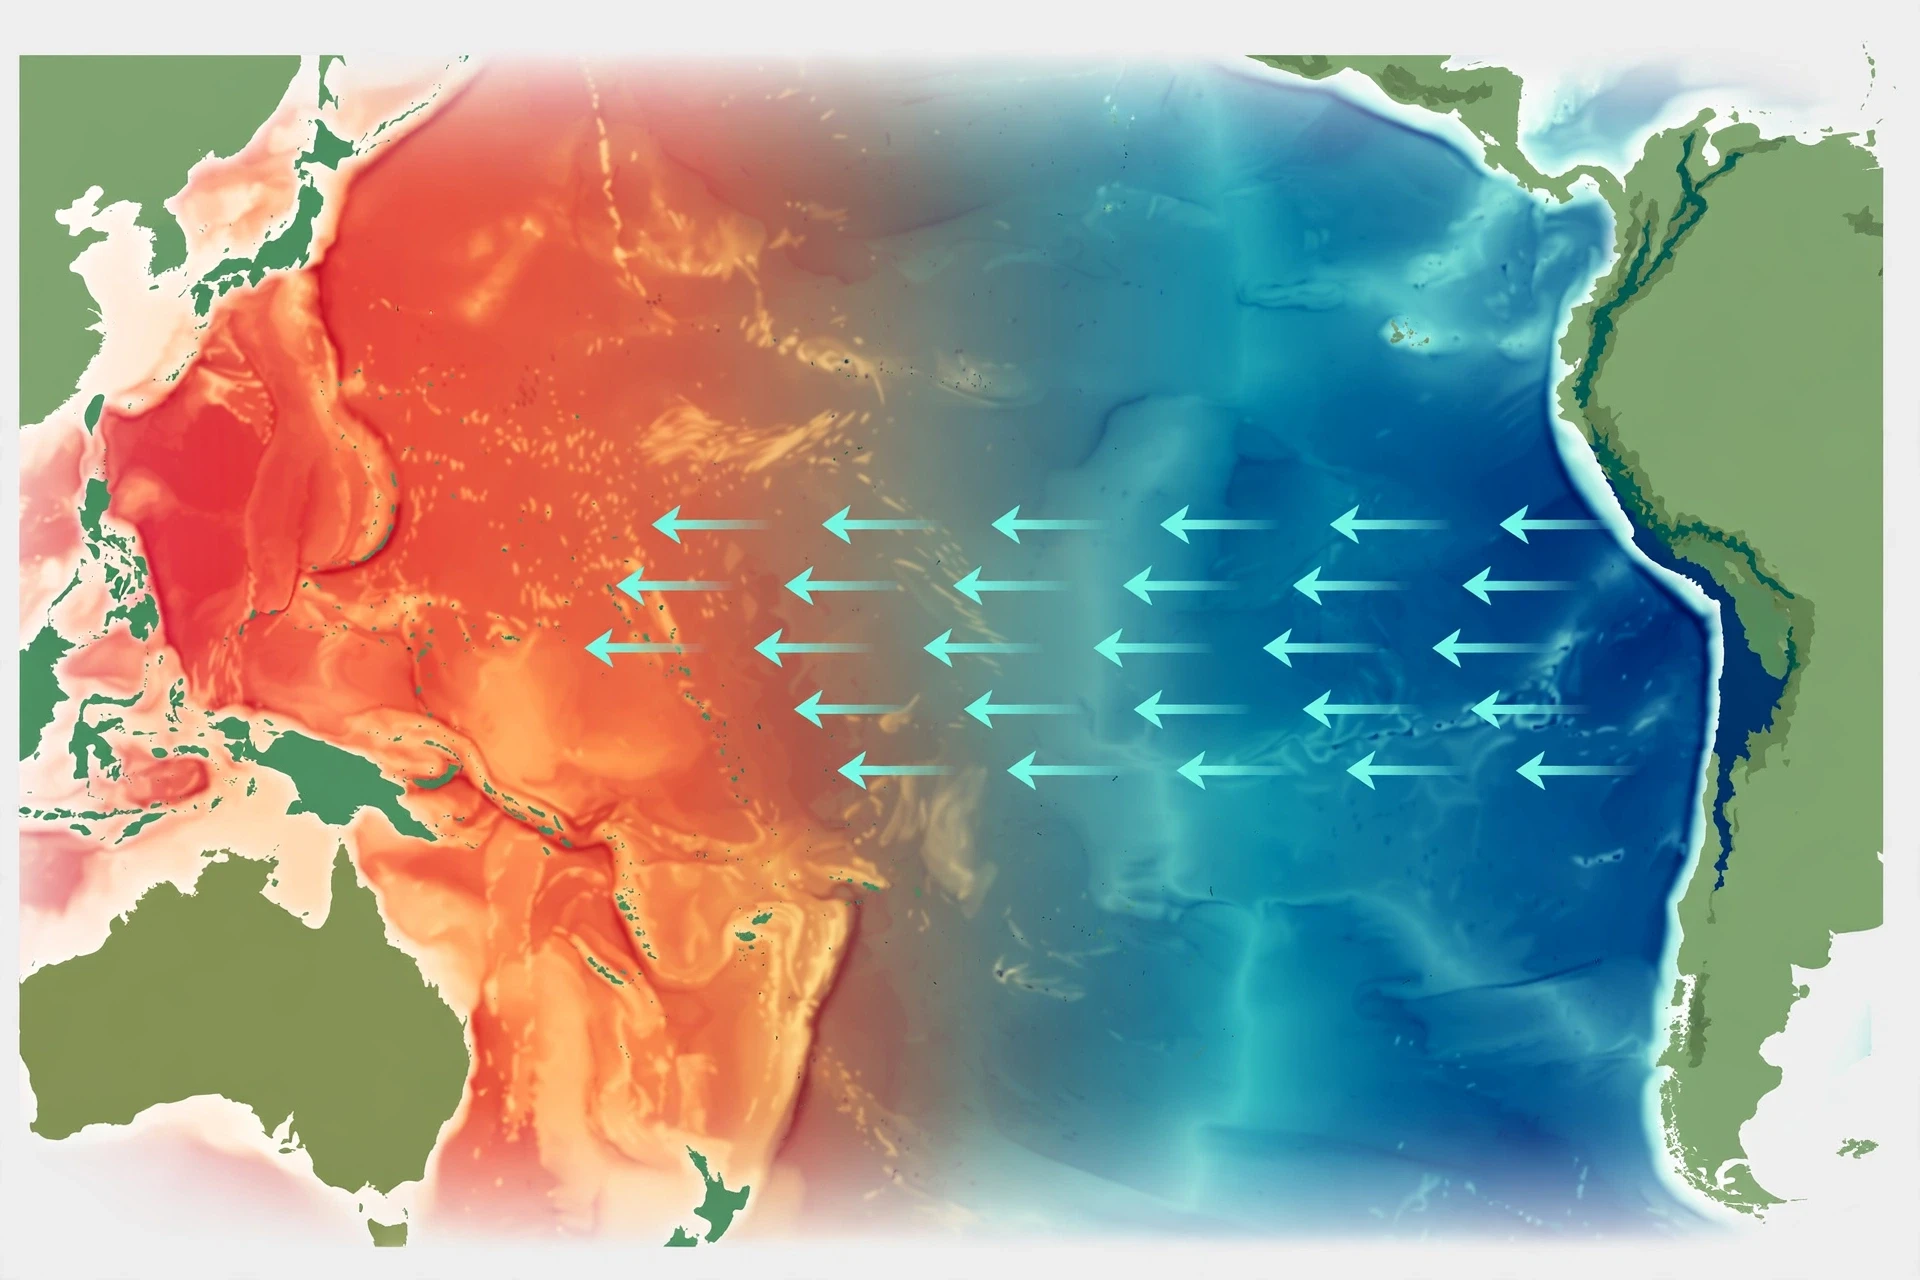
I first grasped the scale of this when I was watching a satellite map of sea-surface temperature with a colleague who studies ocean currents. The screen showed the Pacific in bands of colour: deep blue in the east, warm orange and red in the west. Then she pulled up the same map from an El Niño year, and the colours had slid eastward like paint poured across a table. "That," she said, pointing at a tongue of warm water stretching toward Peru, "is why it rained in the desert." I have never looked at a weather forecast the same way since.
This article explains how that happens. We will start with the tropical Pacific itself, the engine room of the whole system, and the trade winds that push its waters around. Then we will look at what changes when el niño warms the eastern Pacific, what changes when La Niña cools it, and what happens in the years when neither is in charge. After that comes the part most readers care about most: the droughts, floods, hurricanes and monsoons that follow, how scientists forecast these events months ahead, and what a warming climate might mean for the cycle in the decades to come.
1. The Tropical Pacific: Earth's Weather Engine
The tropical Pacific is the largest single feature on the surface of the Earth. It stretches from the coast of South America in the east to the islands of Southeast Asia and Australia in the west, and it straddles the equator for more than half the circumference of the planet. Its surface area is so large that if you could drain it, you would be looking at a basin bigger than all the land on Earth combined, minus a little. The amount of heat it stores is enormous, and heat is what drives weather.
1.1 Why the equator matters
Sunlight falls most directly on the equator. That is not a poetic statement; it is geometry. Near the equator the Sun's rays strike the surface almost straight down, so the same amount of energy is spread over a smaller area than it is at higher latitudes, where the rays arrive at a slant. The result is that tropical oceans soak up more heat than oceans anywhere else.
Warm water evaporates. Evaporation lifts huge amounts of water vapour into the air, and water vapour carries energy with it. When that vapour rises, cools and condenses into clouds, the energy is released again, high in the atmosphere. This is the engine that powers the great tropical rain systems, the trade winds and the vast overturning circulation of air that shapes weather from the equator to the mid-latitudes. The tropical Pacific, being the widest tropical ocean, is the biggest single contributor to that engine.
That is why a change in the temperature of the tropical Pacific is never just a local event. Warm the water in one place, and you change where the air rises and where it sinks. Change where the air rises, and you change where the rain falls. Change where the rain falls, and you change which continents are wet and which are dry. The whole chain starts with a few degrees of ocean temperature.
1.2 A sea of contrasts
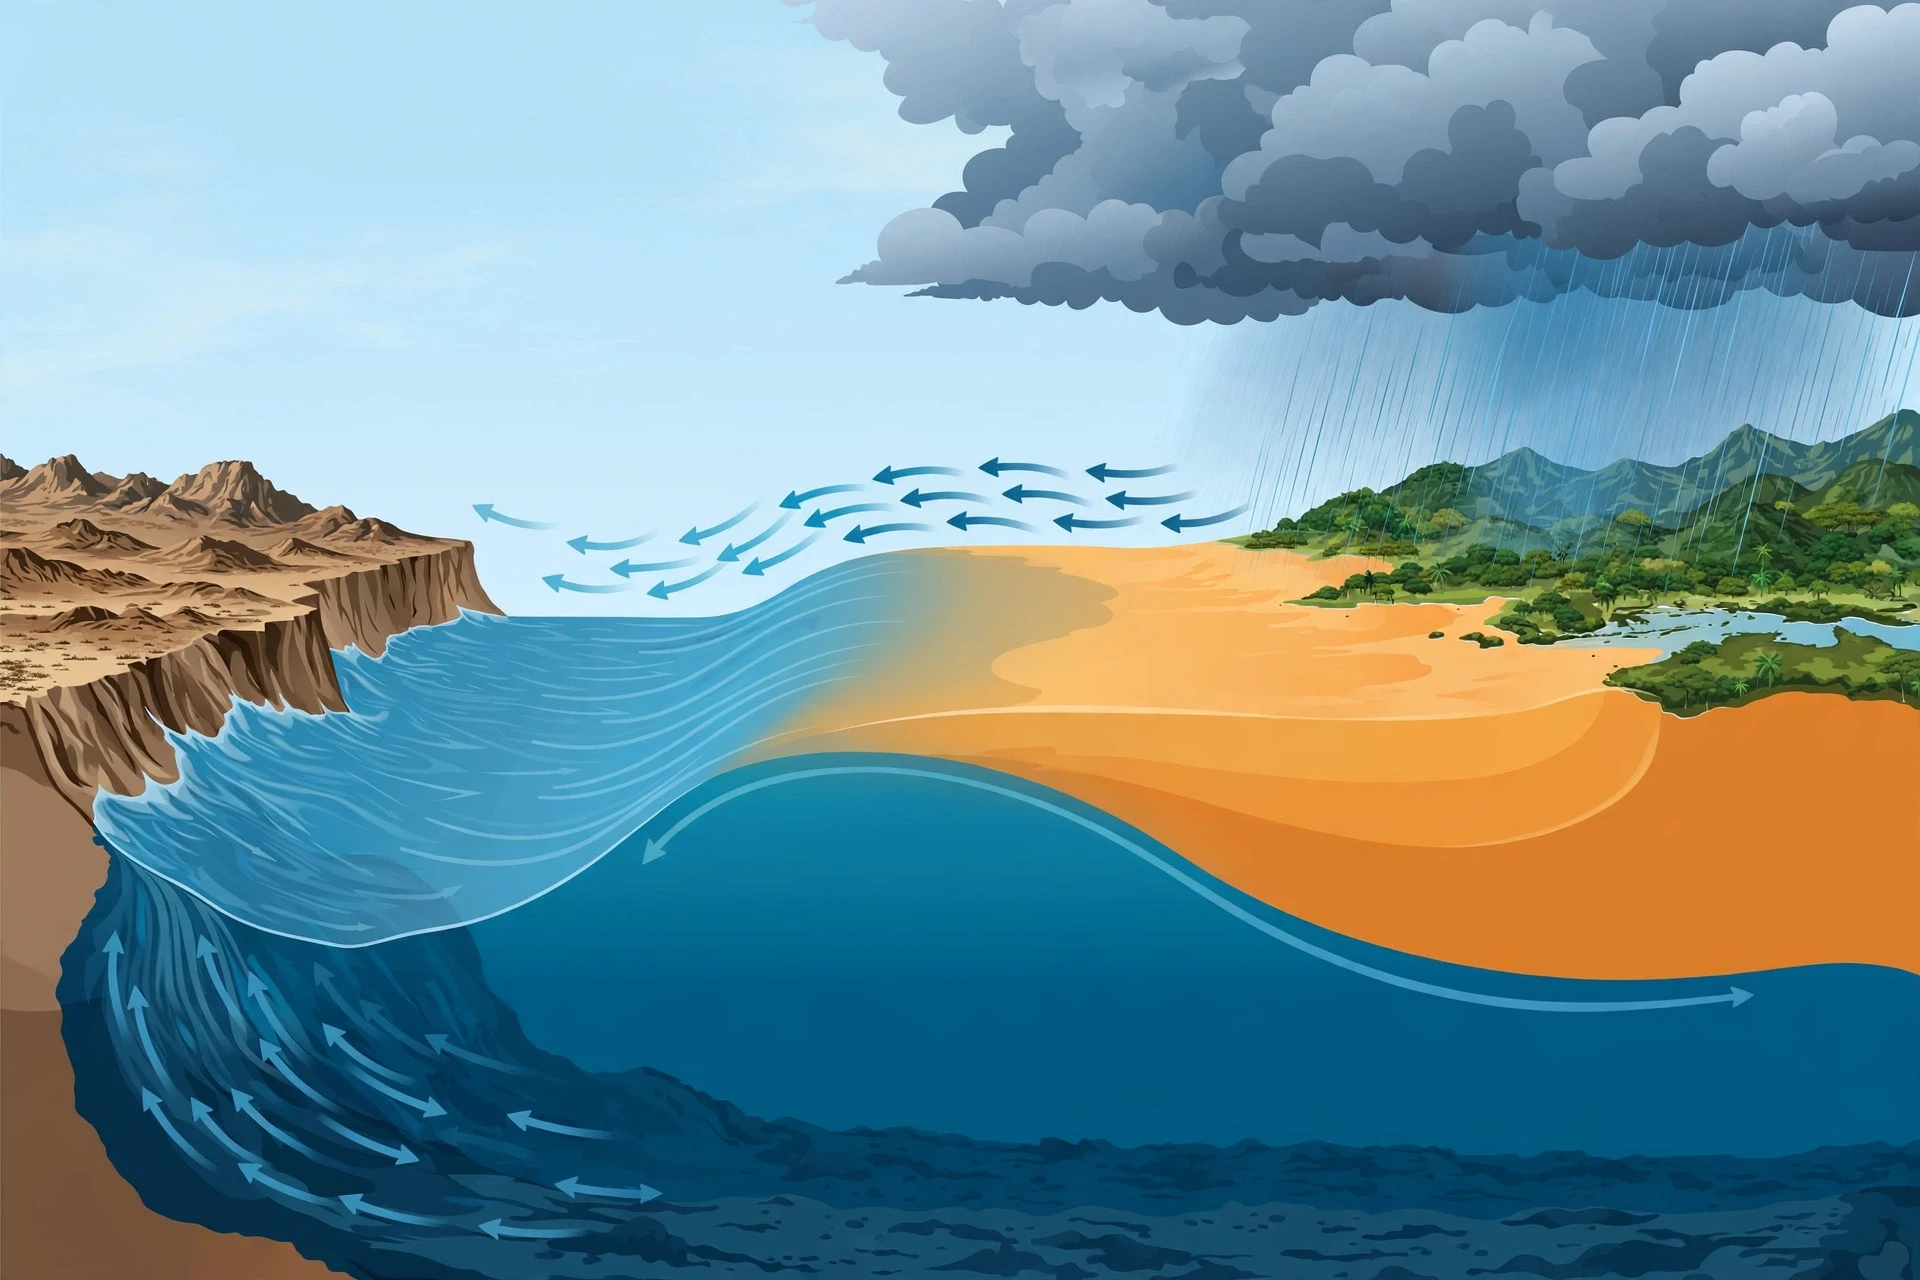
In a normal year, the tropical Pacific is a sea of contrasts. The western side, near Indonesia and northern Australia, holds some of the warmest open-ocean water on the planet, often above 28 degrees Celsius. The eastern side, off the coast of Peru and Ecuador, is much cooler, sometimes by five degrees or more. That contrast is not an accident. It is maintained, day after day, by the wind.
Warm water in the west means warm, moist air rising over Indonesia. That rising air feeds towering thunderstorms, and Indonesia and its neighbours get some of the heaviest rainfall on Earth. Cool water in the east means the air above it is stable and dry, so the coast of Peru stays almost rainless. The Atacama Desert exists, in large part, because the ocean beside it is cold.
This east-west contrast also drives the atmosphere above it. Air rises over the warm west, travels eastward high in the atmosphere, sinks over the cool east, and returns westward near the surface. That returning surface flow is the trade winds, and the whole loop is called the Walker circulation, after the British scientist Gilbert Walker, who first mapped its pressure seesaw more than a century ago. Walker's work was slow, patient detective work with ship logs and barometer readings, done decades before satellites existed. He noticed that when pressure was high over the eastern Pacific, it tended to be low over Indonesia, and the other way around. He had found the heartbeat of the system without ever seeing it from space.
1.3 The warm pool and the cold tongue
Oceanographers have names for the two ends of this contrast. The warm water piled up in the west is called the warm pool. It is a lens of warm surface water, sometimes a hundred metres deep, sitting over cooler water below. The cool water stretching westward from South America along the equator is called the cold tongue. It is the surface expression of cold, nutrient-rich water rising from the deep.
Between them sits a sloping boundary called the thermocline, the layer where temperature drops quickly with depth. In the west, the thermocline is deep, pushed down by the piled-up warm water. In the east, it is shallow, close to the surface, because the warm layer there is thin. That slope matters enormously, as we will see, because it decides how easily cold water can reach the surface.
Think of it like a swimming pool with a warm layer floating on a cold layer, tilted so the warm layer is thick at one end and thin at the other. Push the water around, change the tilt, and you change the temperature at the surface everywhere. That, in essence, is what El Niño and La Niña do.
1.4 Why the Pacific leads the climate
Other oceans have their own moods. The Atlantic has its swings, and the Indian Ocean has its dipole. But none of them matches the Pacific for sheer influence. The Pacific is the widest ocean, its tropical band is the longest, and the Walker circulation above it is the strongest of its kind. When the Pacific changes state, the atmosphere above it changes state, and the atmosphere is a single connected fluid. A shift over the Pacific sends ripples — literally, waves in the atmosphere — that travel around the globe.
Scientists call the combined ocean-atmosphere system ENSO, short for El Niño–Southern Oscillation. The "El Niño" part names the ocean warming; the "Southern Oscillation" part names the seesaw in air pressure that Walker discovered. Together they describe one system with three states: El Niño, La Niña, and neutral. The rest of this article walks through each of them in turn, and then through the weather they bring.
If you want a deeper grounding in how weather forecasting works in general, our guide to meteorology explains the tools forecasters use, from satellites to computer models. The ocean side of the story — currents, upwelling and the layered structure of the sea — is covered in our guide to oceanography.
2. Trade Winds and Upwelling: The Machinery That Moves the Ocean
Every climate story needs a mechanism, and the mechanism here is wind. The trade winds are the steadiest winds on Earth. They blow from east to west across the tropical Pacific, day after day, year after year, driven by the same large-scale circulation that makes the tropics hot and the subtropics dry. Sailors have relied on them for centuries; the name "trade" comes from their use in trade routes, not from commerce in the modern sense, but from the old meaning of the word as a steady course or path.
2.1 How the wind piles up an ocean
Wind does not just ruffle the surface of the sea. It drags the water with it. The trade winds drag warm surface water westward across the Pacific, and because the ocean is bounded by continents at both ends, the water has nowhere to go. It piles up. Sea level near Indonesia sits measurably higher than sea level near Peru — by tens of centimetres — purely because the wind has pushed water westward and held it there.
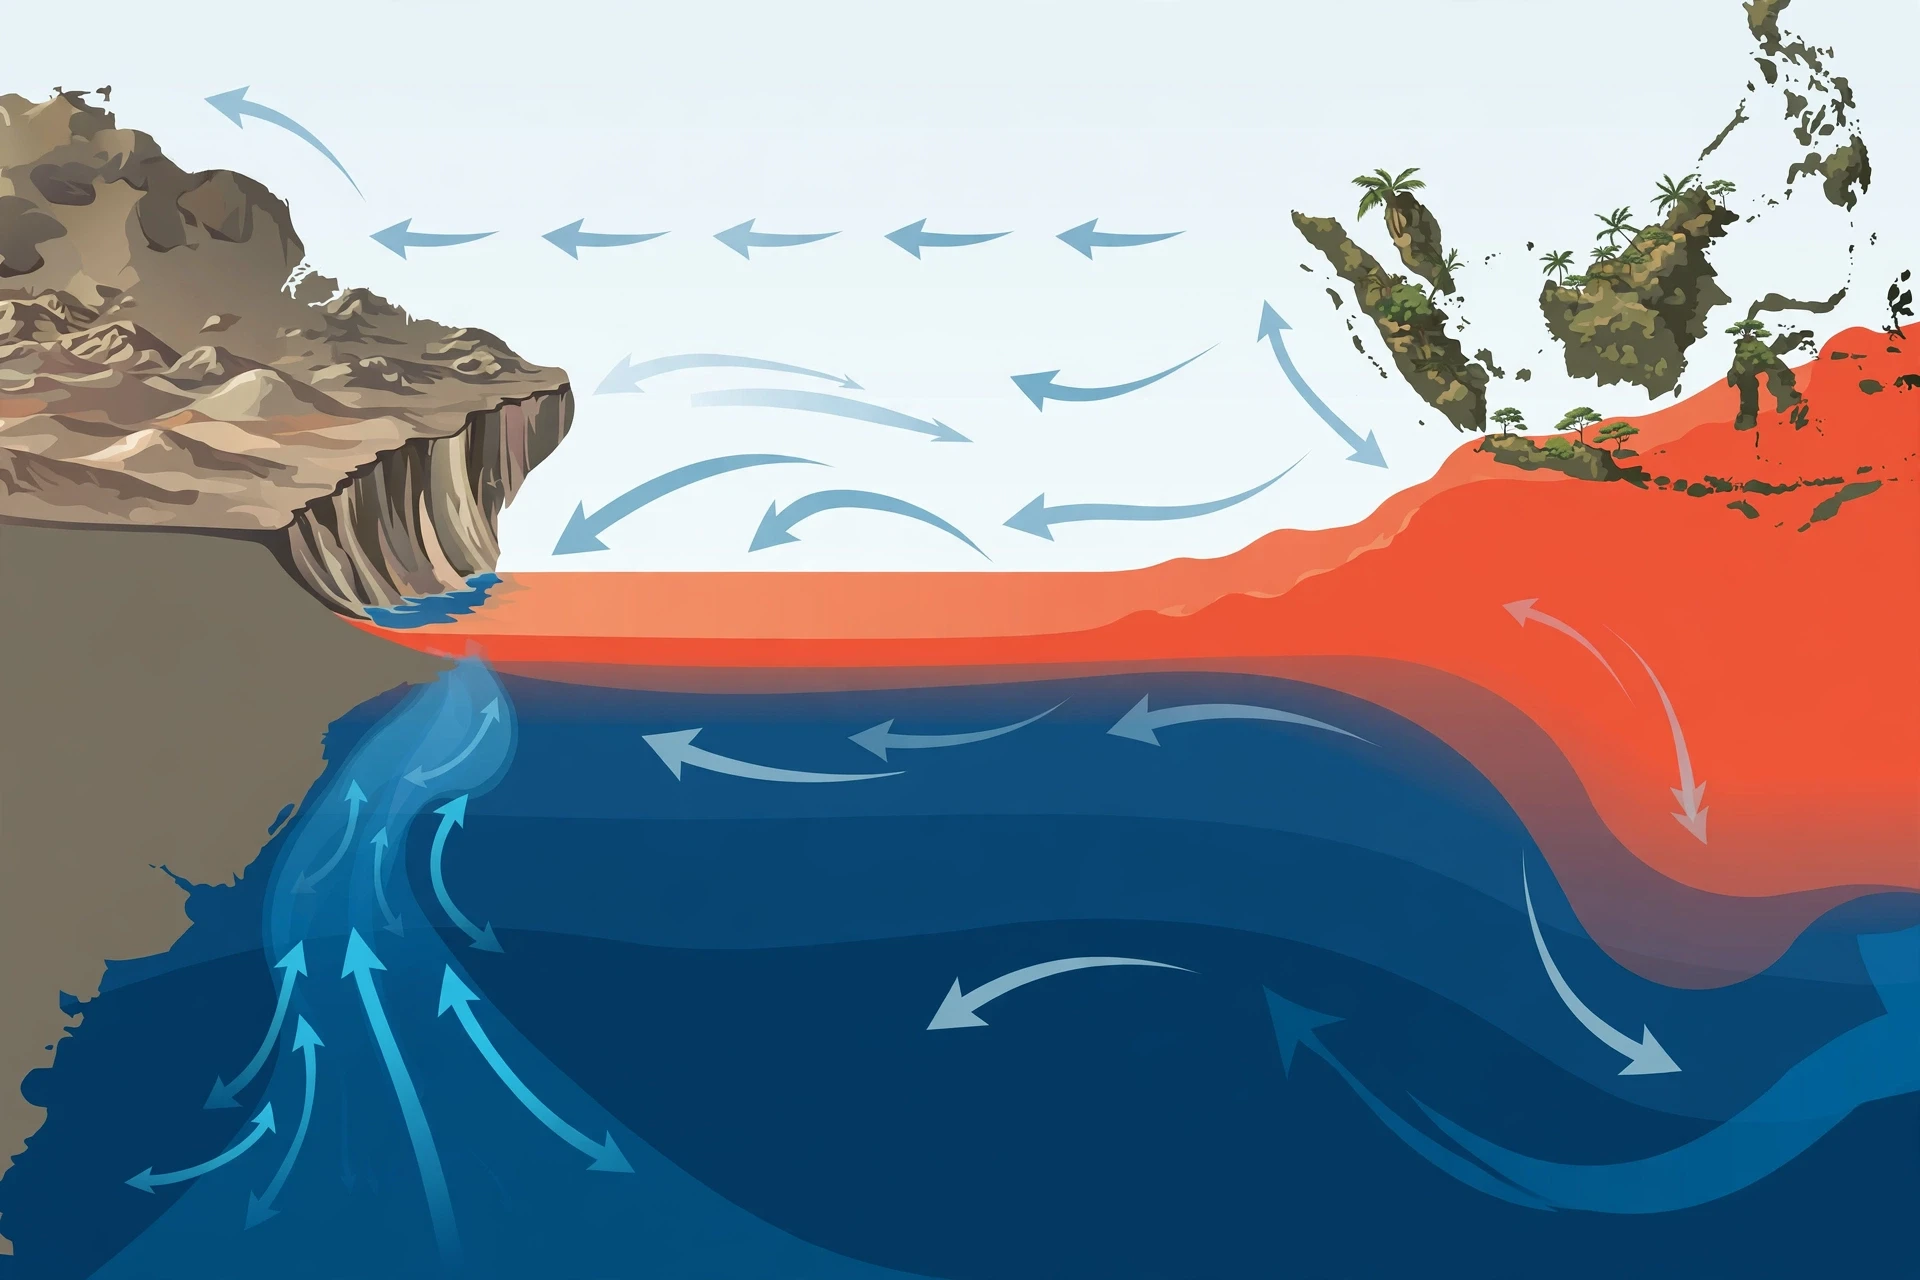
That piled-up water is warm, and it is deep. It is the warm pool of the previous section. At the same time, the wind is doing something else on the eastern side. As surface water is dragged away from the coast of South America, water from below rises to replace it. This is upwelling, and it is one of the most important processes in the ocean.
Upwelling brings cold water to the surface, and with it, nutrients. The deep ocean is rich in the nitrogen, phosphorus and other chemicals that tiny marine plants need to grow, because dead organisms sink and decay there. When upwelling lifts that water into the sunlight, plankton bloom, small fish gather to eat the plankton, and larger fish gather to eat the small fish. The fisheries off Peru are among the most productive in the world for exactly this reason. The cold tongue is not just a temperature pattern; it is a food web.
2.2 The thermocline and why its slope matters
Picture the ocean as two layers: a warm, well-mixed surface layer, and cold, still water below, separated by the thermocline. In the western Pacific, the warm layer is thick and the thermocline sits deep, often 150 metres down or more. In the eastern Pacific, the warm layer is thin and the thermocline is shallow, sometimes only a few tens of metres below the surface. Upwelling in the east can easily reach the thermocline and pull cold water up. Upwelling in the west cannot; it just stirs warm water.
This asymmetry is the key to the whole ENSO system. Anything that changes the wind changes the tilt of the thermocline. Weaken the trade winds, and the warm water sloshes back eastward, the thermocline in the east sinks, and upwelling brings up warmer water. Strengthen the trade winds, and the warm water piles up even higher in the west, the thermocline in the east rises even closer to the surface, and upwelling brings up even colder water. The wind is the hand on the tap, and the thermocline is the tap.
I remember a lecturer drawing this on a blackboard with two chalk lines, one sloping gently, one sloping steeply, and saying, "Everything else is commentary." He was exaggerating, but only a little. If you understand the wind, the thermocline and upwelling, you understand most of what follows.
2.3 The feedback loop that makes ENSO swing
Here is where the story gets interesting, because the ocean and the atmosphere do not just push each other around — they amplify each other. Scientists call this the Bjerknes feedback, after the Norwegian meteorologist Jacob Bjerknes, who worked out the loop in the 1960s.
It goes like this. Suppose the trade winds weaken a little, for reasons that may start as ordinary weather noise. Warm water spreads eastward. The eastern Pacific warms. Warm water in the east means the air above it warms and rises, which weakens the east-west temperature contrast that drives the trade winds in the first place. Weaker contrast means weaker winds. Weaker winds mean more warm water spreading east. The loop feeds on itself, and a small nudge grows into a full El Niño.
The same loop works in reverse. Suppose the trade winds strengthen a little. More warm water piles up in the west, the east cools further, the east-west contrast grows, and the contrast drives even stronger winds. A small nudge grows into a full La Niña.
The ocean and the atmosphere are not two separate systems taking turns. They are one system, and once it starts moving in a direction, it tends to keep going until something stops it.
What stops it? The ocean has its own slow memory. Waves travel across the Pacific basin over months, reflecting off continents and returning, and the heat stored in the subsurface slowly discharges and recharges. Eventually the system runs out of momentum, swings back through neutral, and often overshoots into the opposite phase. That is why El Niño is so often followed by La Niña, and why the whole cycle takes years rather than weeks.
2.4 What fishermen noticed first
Long before satellites or climate models, Peruvian fishermen knew something changed in the ocean every few years, usually around Christmas. The cold, fish-rich water would vanish, replaced by warm water with few fish. Seabirds starved. Anchovy catches collapsed. The fishermen called the warm current "El Niño" — the little boy, or the Christ child — because it arrived near Christmas. The name stuck, and scientists later adopted it for the whole basin-wide warming.
La Niña, the little girl, got its name much later, as the cool counterpart. The fishermen's observations were local, but they were pointing at a global phenomenon. That is a pattern in science worth remembering: the people who work with a system every day often notice its moods before the instruments do.
3. El Niño: When the Eastern Pacific Warms
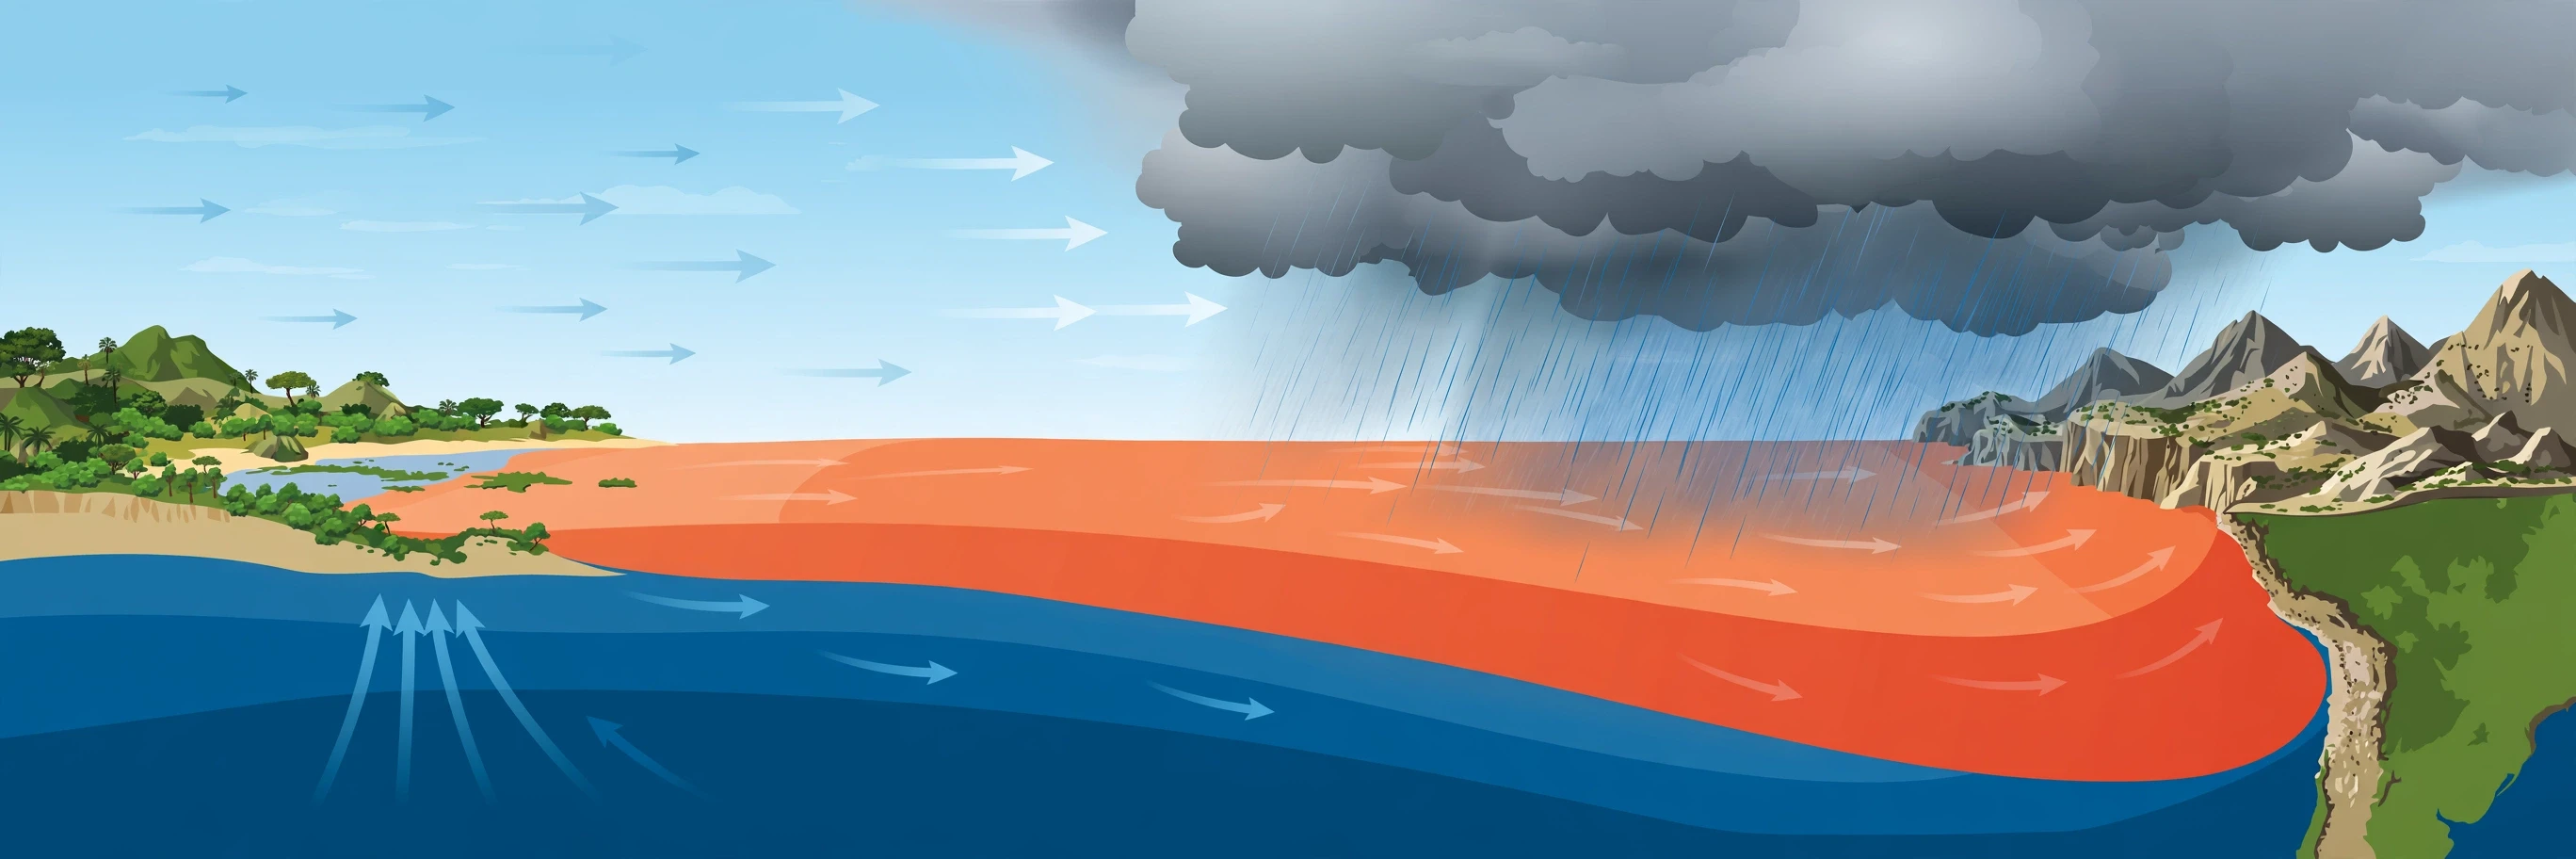
El niño is the warm phase of ENSO. It begins when the trade winds weaken, warm water spreads eastward, and the eastern and central tropical Pacific become warmer than usual. The definition scientists use is precise: the Oceanic Niño Index, a three-month average of sea-surface temperature in a region of the central Pacific called Niño 3.4, stays at least 0.5 degrees Celsius above its long-term average for five consecutive overlapping three-month periods. That threshold matters because it separates a real event from ordinary month-to-month wobble. NOAA's Climate Prediction Center tracks the index and issues the official status, and its data pages let anyone follow the numbers as they come in (NOAA Climate Prediction Center).
3.1 How an El Niño event builds
An El Niño does not switch on overnight. It builds over months. The first sign is often a weakening of the trade winds in the western Pacific, sometimes triggered by bursts of westerly wind that push warm water eastward in waves. These waves, called Kelvin waves, travel along the equator and deepen the thermocline as they go. As the thermocline sinks in the east, upwelling brings up warmer water, the surface warms, and the Bjerknes feedback takes over.
By the time the event peaks — usually late in the calendar year, in the northern hemisphere winter — the warm water can stretch across most of the tropical Pacific. Sea-surface temperatures in the eastern Pacific may run two or three degrees above average, and in the strongest events, even more. The cold tongue shrinks or disappears. The warm pool, once confined to the west, now extends almost to South America.
The atmosphere responds by shifting its rising air eastward. The thunderstorms that normally sit over Indonesia move into the central Pacific. Rainfall follows them. Places that are normally wet become dry, and places that are normally dry become wet. That single shift explains most of the global effects we will cover in Section 6.
3.2 Two flavours: eastern and central Pacific events
Not all El Niño events look the same. In the classic, eastern Pacific kind, the strongest warming sits close to South America. In the other kind, sometimes called a central Pacific El Niño or El Niño Modoki — Modoki is a Japanese word meaning "similar but different" — the strongest warming sits in the middle of the ocean, and the effects on global weather are different in detail. The central Pacific kind has become more common in recent decades, and researchers are still working out why, and what it means for forecasts.
The distinction matters because the location of the warm water decides where the air rises, and where the air rises decides where the rain falls. Two events with the same peak temperature can produce quite different weather in, say, the southern United States or eastern Australia, depending on where the warmest water sits. Forecasters therefore watch not just how warm the Pacific is, but where it is warm.
3.3 The 1997–98 event: the one that rewrote the textbooks
If you ask climate scientists which El Niño changed their field, most will name 1997–98. It was one of the strongest on record. Sea-surface temperatures in the eastern Pacific ran far above average. Peru received torrential rain, and floods and mudslides killed hundreds of people and destroyed roads, bridges and homes. California was battered by storms. Indonesia and Australia suffered severe drought and fires. The global average temperature spiked, and 1998 became, at the time, the warmest year on record.
I was a student when the satellite images from that event started circulating, and I still remember the map: a vast tongue of red across the Pacific, so wide it looked like a printing error. It was not an error. It was the ocean showing, in colour, what it could do. The 1997–98 event did more than any single study to convince the public, and many governments, that ENSO was not an academic curiosity. It was a force that moved economies, food supplies and lives.
The 2015–16 event rivalled it in strength and broke temperature records of its own. Together, the two events give scientists a yardstick for what a very strong el niño can do — and a warning about what to prepare for when the next one comes.
3.4 What El Niño does to the ocean itself
The warming is not only a surface story. When the thermocline sinks in the east, the cold, nutrient-rich water that normally feeds the Peruvian fisheries stays deep. Plankton blooms shrink, anchovy stocks collapse, and seabirds and sea lions that depend on them starve. The effect ripples up the food web and into the fishing industry. In strong events, the anchovy catch — one of the largest fisheries in the world by weight — can fall dramatically, with consequences for fishmeal, animal feed and the livelihoods of coastal communities.
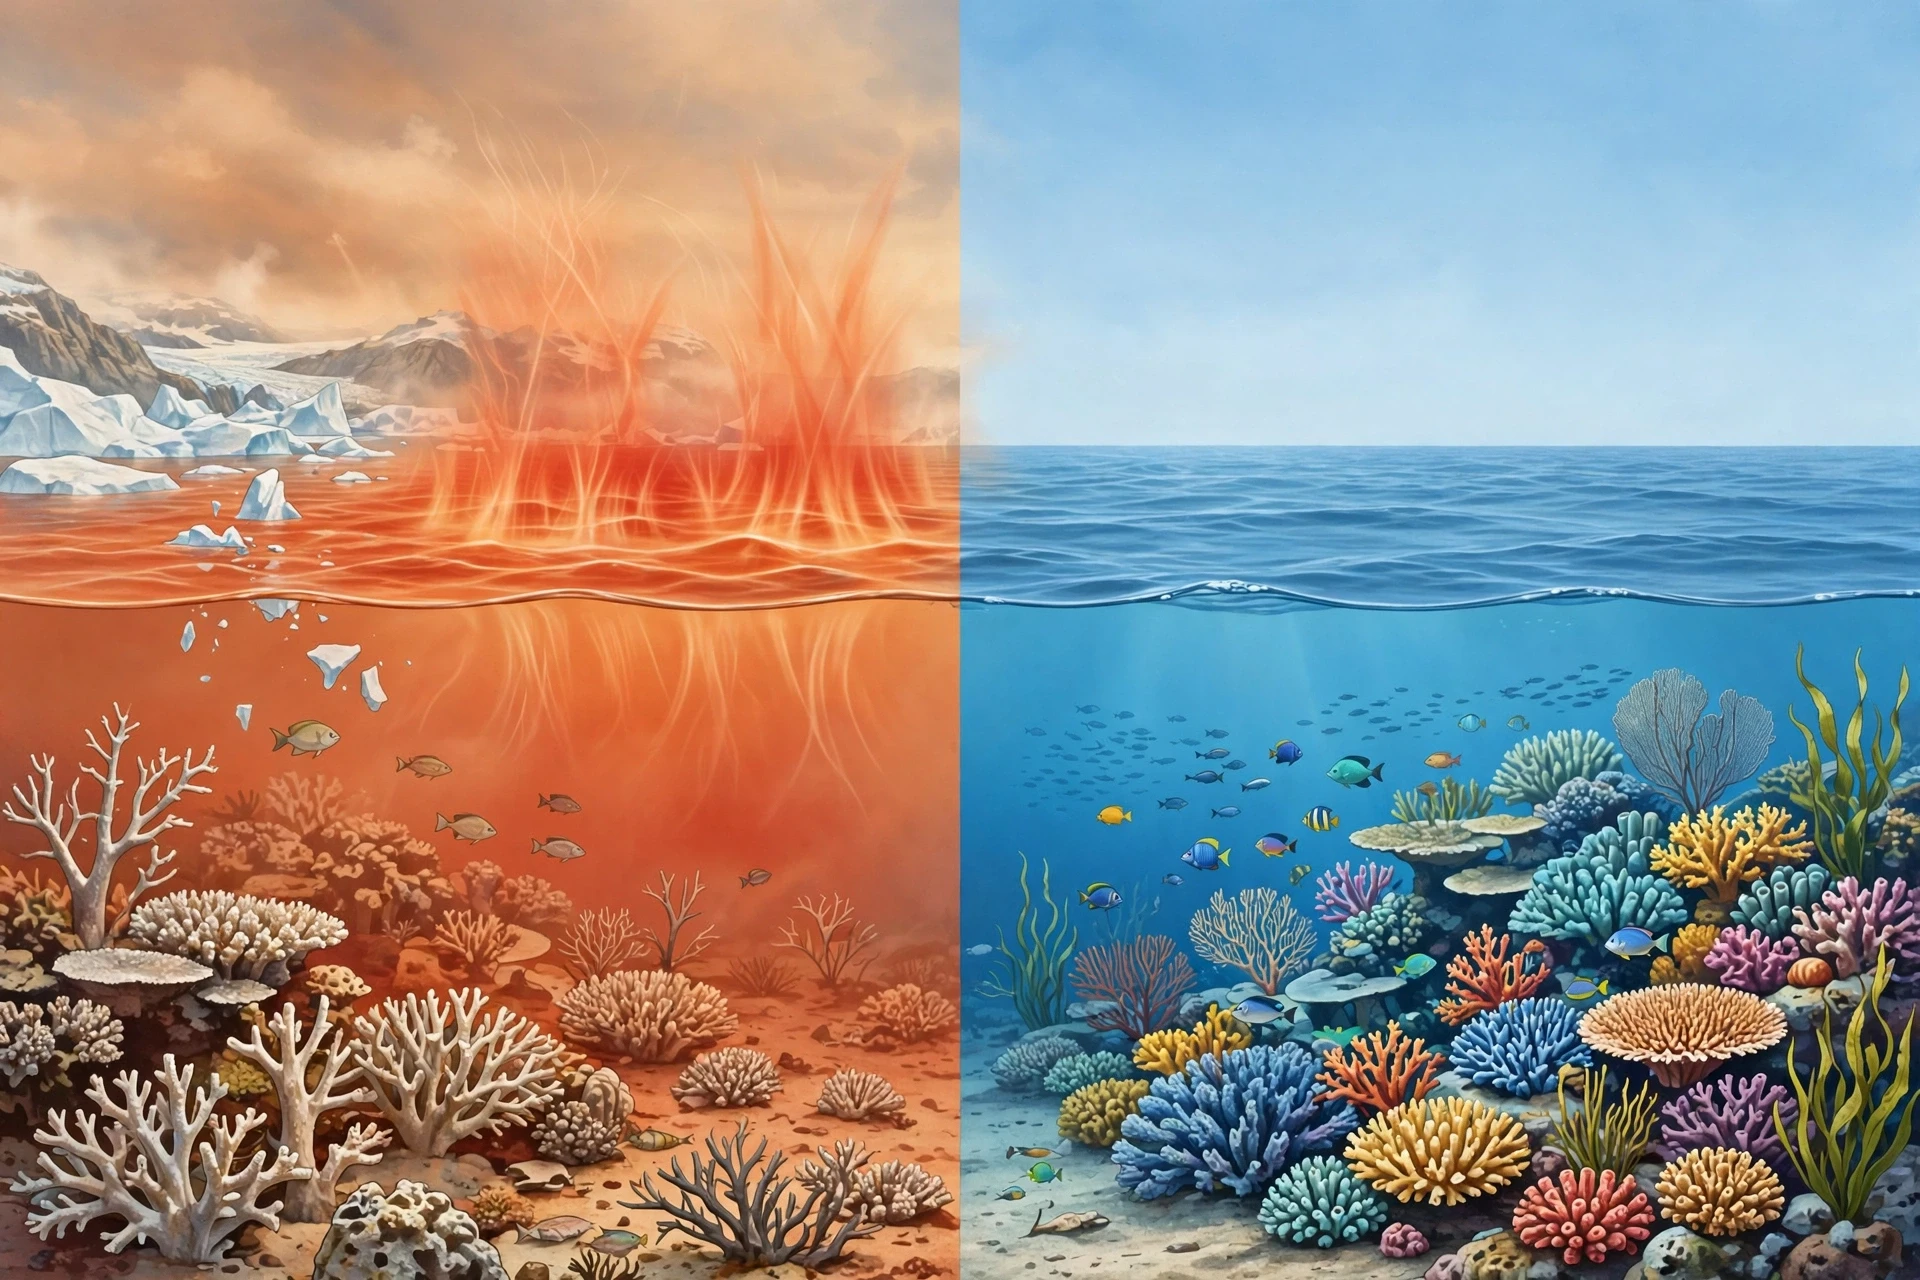
Warm water also holds less dissolved oxygen than cold water, and it changes where fish can live. Tuna, which follow warm water, move eastward during El Niño, and fishing fleets follow them. Coral reefs in the eastern Pacific can bleach when water stays too warm for too long. The ocean is not a passive backdrop to the weather story; it is a living system, and El Niño rearranges it.
3.5 How long does El Niño last?
A typical El Niño lasts nine to twelve months, though some have lasted longer. They usually begin in the northern hemisphere spring or summer, grow through the autumn, peak in winter, and decay in the following spring. That seasonal rhythm is tied to the annual cycle of winds and ocean temperatures, which is why forecasters talk about a "spring predictability barrier" — forecasts made in spring are harder than forecasts made later in the year, because the system is then at its weakest and most easily nudged.
After an El Niño ends, the Pacific often does not simply return to normal and stay there. It frequently swings into La Niña, the cool phase. That swing is part of the cycle, not a separate event, and it is one reason forecasters watch the months after an El Niño with particular care.
4. La Niña: When the Pacific Cools
La Niña is the cool phase of ENSO, and in many ways it is El Niño in reverse. The trade winds strengthen, warm water piles up even higher in the west, upwelling in the east intensifies, and the central and eastern tropical Pacific become cooler than usual. The formal definition mirrors El Niño's: the Oceanic Niño Index stays at least 0.5 degrees Celsius below its long-term average for five consecutive overlapping three-month periods. NOAA's ocean service explains the pair together in plain language, and it is a good first stop for readers who want the official picture (NOAA Ocean Service).
4.1 How La Niña builds
La Niña often follows an El Niño, but it can also develop on its own. The trade winds strengthen, sometimes after a burst of easterly wind, and the warm pool is pushed hard against the western boundary. The thermocline in the east rises toward the surface, so upwelling pulls up even colder water. The cold tongue extends farther west than usual, and the east-west temperature contrast grows.
The atmosphere responds in the opposite direction to El Niño. Rising air concentrates even more strongly over the warm west, so Indonesia, northern Australia and Southeast Asia get even more rain than usual. Sinking air over the cool central and eastern Pacific strengthens, so those regions get even less. The Walker circulation, in effect, goes into overdrive.
4.2 What La Niña brings
The effects of La Niña are often described as the mirror image of El Niño, but the mirror is not perfect. Some regions do see opposite effects — the southwestern United States, for example, tends to be drier during La Niña and wetter during El Niño, while Indonesia tends to be wetter during La Niña and drier during El Niño. Other regions see effects that are similar in both phases, or effects that depend on the strength and flavour of the event. The details matter, and they are the reason forecasters give probabilities rather than certainties.
One of the most consistent La Niña effects is on Atlantic hurricanes. During La Niña, the winds high in the atmosphere over the tropical Atlantic tend to be calmer, with less of the shearing wind that tears young storms apart. That gives hurricanes a better chance to form and strengthen, and La Niña years are often busy Atlantic hurricane seasons. We will return to this in Section 7, because it is one of the clearest and most consequential links in the whole ENSO story.
La Niña also tends to bring cooler global average temperatures than El Niño years, because the cool Pacific absorbs heat and the atmosphere above it cools. The effect is small compared with the long-term warming trend — a La Niña year today can still be warmer than an El Niño year from thirty years ago — but it is real, and it shows up in the yearly temperature rankings.
4.3 The long La Niña of 2020–23
Most La Niña events last one winter. Some last two. The La Niña that began in 2020 lasted three winters, into early 2023, an event scientists call a triple-dip La Niña. It was the first triple-dip of the century, and it brought a long run of consequences: severe drought in the Horn of Africa and in parts of South America, flooding in Australia, and three consecutive busy Atlantic hurricane seasons.
I followed that event the way many people follow a long-running story, checking the monthly updates and watching the Pacific refuse to warm. Each winter, forecasters expected it to fade; each winter, it held on. The triple-dip was a reminder that ENSO does not follow a timetable, and that the ocean can stay in one state far longer than the averages suggest. It also showed how the impacts of a single phase can accumulate: a one-year drought is hard; a three-year drought, layered on top of other pressures, is a humanitarian crisis.
A single year of La Niña is a weather story. Three years of it is a different kind of story altogether — one measured in failed harvests, empty reservoirs and displaced families.
4.4 La Niña and the ocean
In the ocean, La Niña is a time of plenty for the eastern Pacific fisheries. Strong upwelling brings nutrients to the surface, plankton bloom, and anchovy and other fish thrive. That sounds like unambiguously good news, and for fishermen it often is, in the short term. But the same cold, productive water can also bring its own problems: the cold tongue can extend so far west that it changes where tuna gather, and the heavy rains in the west can flood coastal communities and damage infrastructure.
La Niña also cools the surface of the Pacific so much that it can mask, temporarily, the warming of the ocean as a whole. That is why scientists are careful to separate the ENSO signal from the long-term trend: the Pacific can be cooler than average during a La Niña and still be warmer than it was during a La Niña fifty years ago. Both statements can be true at once, because one compares the Pacific with its recent average and the other compares it with its past.
5. ENSO-Neutral Years: When the Pacific Rests
Between El Niño and La Niña lie the neutral years, when the Oceanic Niño Index sits within half a degree of average and neither phase is in control. Neutral sounds uneventful, and in a sense it is: the trade winds blow at roughly their normal strength, the warm pool sits in the west, the cold tongue sits in the east, and rainfall follows its usual pattern. But neutral is not the same as "no weather". Storms still form, droughts still happen, and other climate patterns — the Indian Ocean Dipole, the North Atlantic Oscillation, the Madden-Julian Oscillation — can still push weather around. Neutral simply means the Pacific is not adding its usual push in either direction.
5.1 Why neutral years matter for forecasters
Forecasters pay close attention to neutral years for a practical reason: they are the baseline against which El Niño and La Niña are measured. Without a good understanding of what "normal" looks like — and how much normal varies from year to year — it is impossible to say what is unusual. The thirty-year averages that define the Oceanic Niño Index are updated regularly, and as the ocean warms, the baseline itself moves. That is a quiet complication in ENSO science: the yardstick changes as the climate changes.
5.2 The cycle as a whole
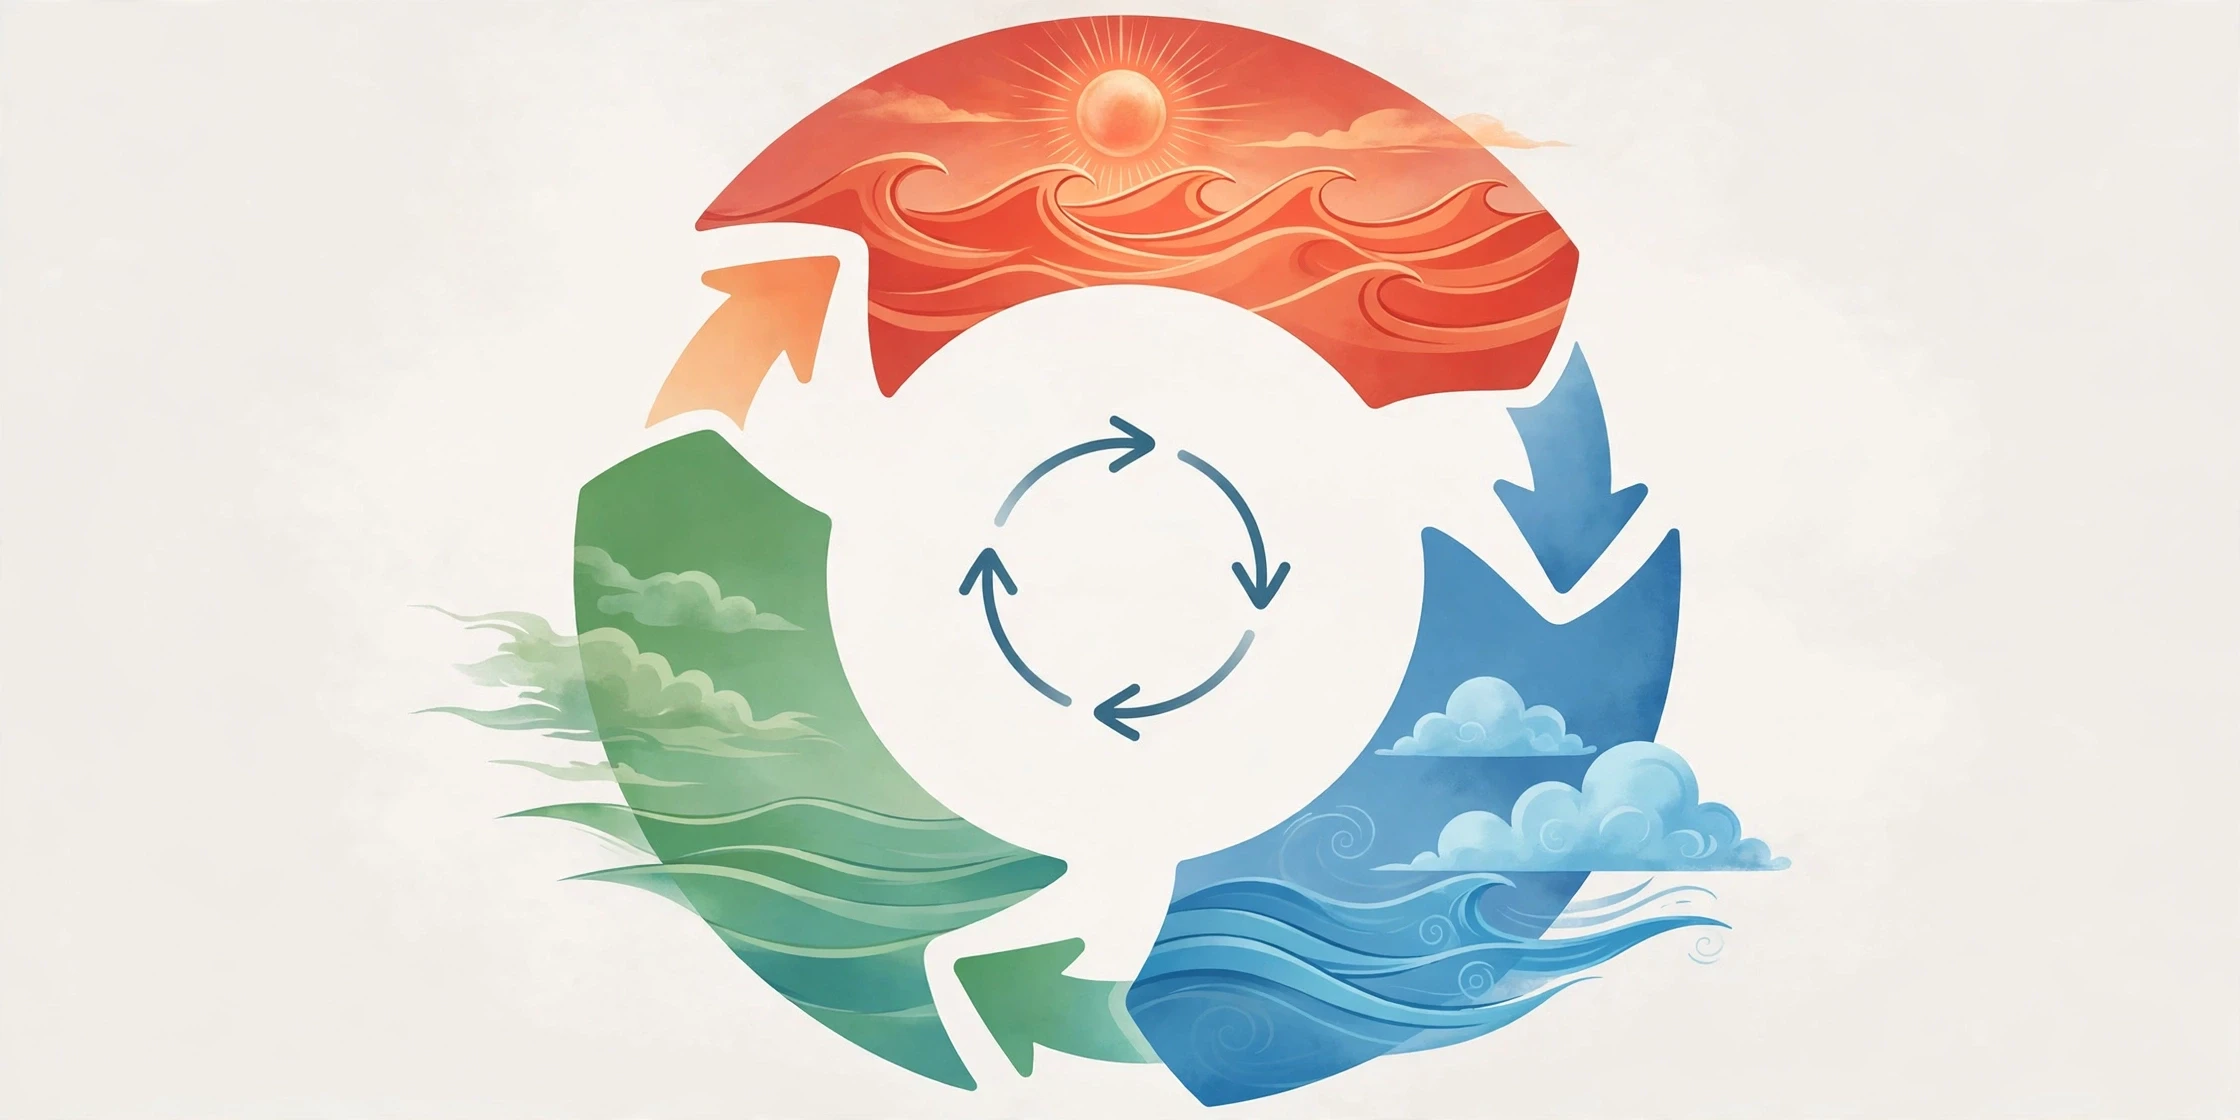
Put the three states together and you get a cycle that typically takes three to seven years to complete, though individual cycles vary widely. A common sequence is El Niño, then La Niña, then neutral, then El Niño again — but there are exceptions to every part of that pattern. Some El Niños are followed by neutral years, not La Niñas. Some La Niñas last for years. Some decades see more El Niños, others more La Niñas.
The irregularity is not a flaw in the science; it is a property of the system. ENSO is a chaotic system in the technical sense: small differences in the starting conditions can grow into large differences in the outcome. That is why forecasts are given as probabilities, and why the exact timing and strength of the next event can only be pinned down a few months ahead, even though the broad tendency can be seen earlier.
5.3 How scientists measure the cycle
The Oceanic Niño Index is the headline measure, but it is not the only one. Scientists also track the Southern Oscillation Index, which measures the pressure difference between Tahiti and Darwin, Australia — the atmospheric half of the seesaw Walker discovered. When pressure is low in Tahiti and high in Darwin, the trade winds are weak and El Niño is likely. When the pattern reverses, La Niña is likely. Other indices track sea level, wind strength, cloud cover and the temperature of the subsurface ocean. Together they give a fuller picture than any single number.
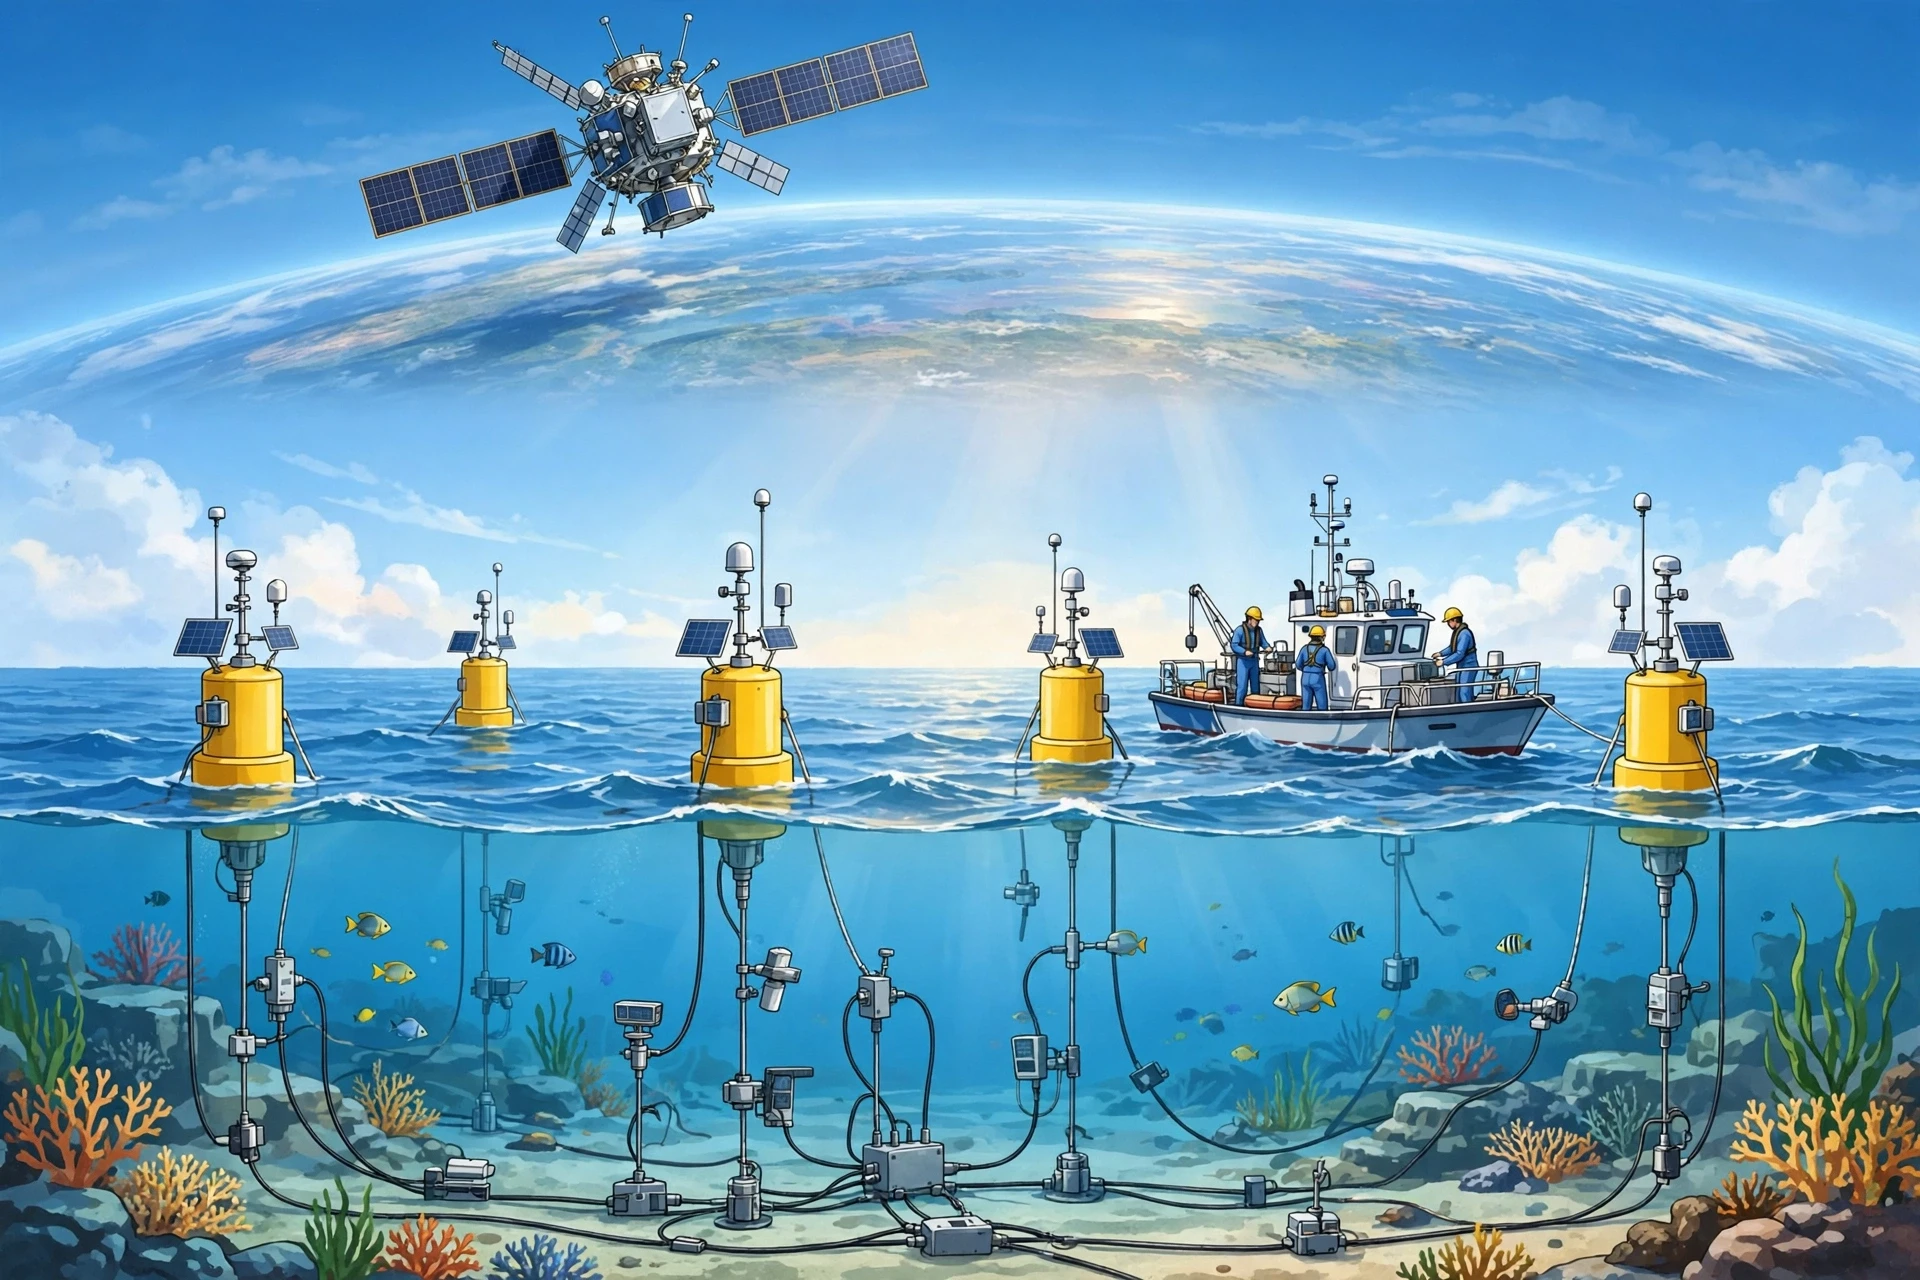
The data behind these indices come from a remarkable observing system: moored buoys strung across the equatorial Pacific, drifting floats, satellites measuring sea-surface temperature and sea level, and ships that have been recording ocean temperatures for more than a century. It is one of the most closely watched patches of ocean on Earth, and for good reason.
6. How El Niño and La Niña Change Weather Worldwide
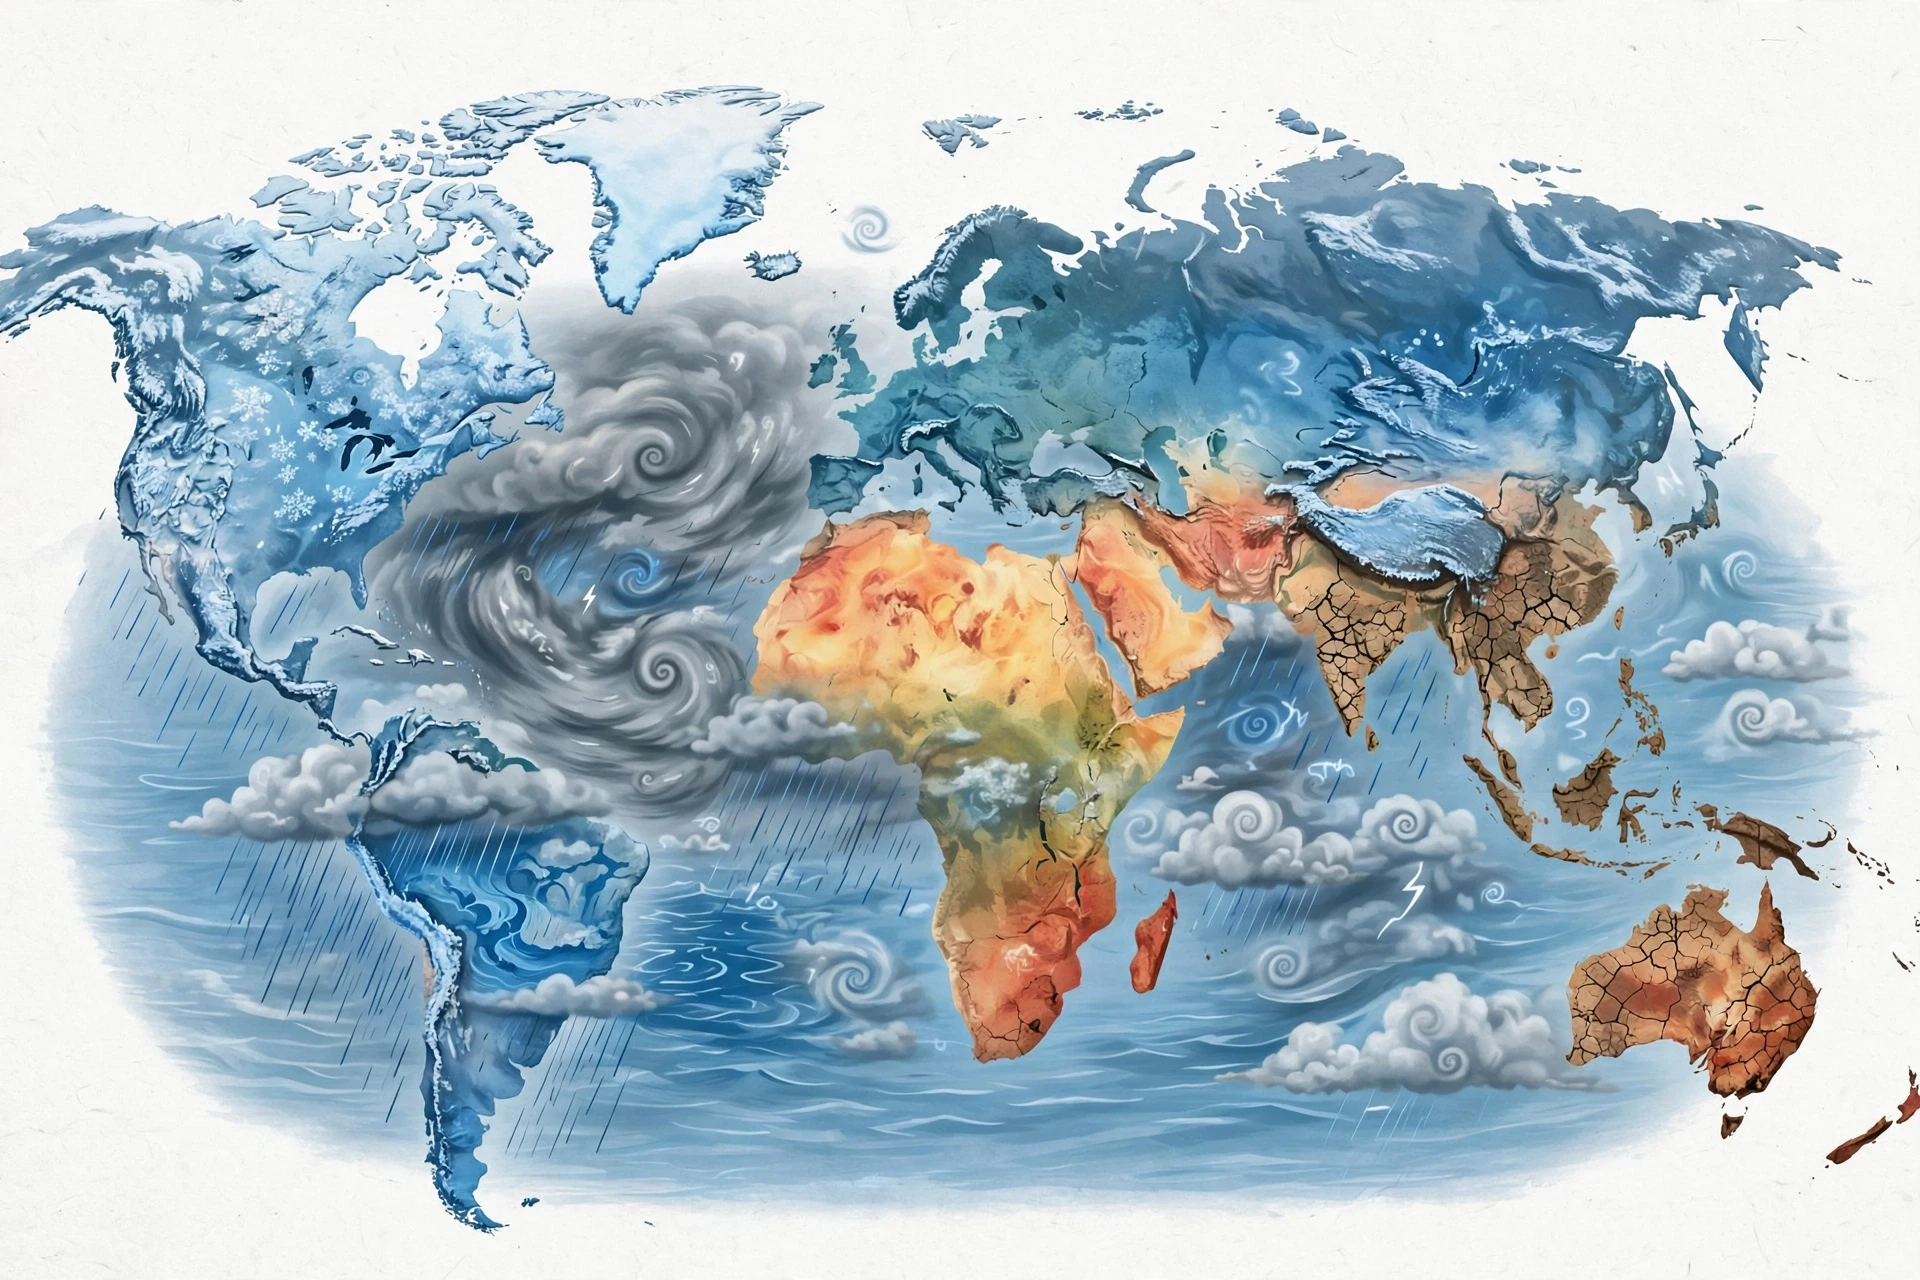
This is the section that turns an ocean story into a human story. When the Pacific shifts, the atmosphere shifts with it, and the effects reach far beyond the ocean itself. The mechanism is a chain of cause and effect: warm water changes where air rises, rising air changes where rain falls, and changing rainfall changes the winds far away through atmospheric waves that ripple across the globe. Scientists call these far-reaching links teleconnections, and they are the reason a warming in the Pacific can mean drought in Africa and floods in South America at the same time.
6.1 The basic pattern: wet gets wetter, dry gets drier — somewhere else
The simplest way to think about teleconnections is this: the rising air over warm water has to come down somewhere, and where it comes down, the air is dry. Move the rising air eastward, as El Niño does, and you move the dry sinking air too. Regions that used to sit under rising, rainy air now sit under sinking, dry air, and regions that used to be dry now sit under rising air.
That is why El Niño so reliably dries out Indonesia, northern Australia and parts of Southeast Asia, while soaking Peru and Ecuador. It is also why La Niña does the opposite. The pattern is not a coincidence; it is the direct result of moving the biggest rising-air column on the planet a few thousand kilometres sideways.
6.2 Droughts and floods
Drought is the most damaging El Niño effect for the largest number of people. When the rains fail over Indonesia, Australia, southern Africa, India and parts of South America, crops fail, water supplies shrink, and food prices rise. The 2015–16 El Niño brought severe drought to southern Africa, leaving millions of people in need of food assistance. The 1997–98 event brought drought and fires to Indonesia on a scale that filled the skies of Southeast Asia with smoke for months.
Floods are the other side of the coin. Peru and Ecuador, normally dry, can receive many times their usual rainfall during a strong El Niño, and the water arrives on landscapes that are not built for it. Rivers burst their banks, mudslides bury roads and houses, and the infrastructure damage can take years to repair. California and the southern United States also tend to be wetter during El Niño, with more storms coming in from the Pacific.
La Niña flips much of this. Australia, which dries out during El Niño, often floods during La Niña — the 2020–23 triple-dip brought repeated, devastating floods to eastern Australia. Southern Africa, dry during El Niño, tends to be wetter during La Niña. The Horn of Africa, meanwhile, has suffered severe drought during recent La Niña events, a reminder that the mirror is not perfect and that local geography matters.
6.3 A region-by-region picture
The table below summarises the typical effects. "Typical" is doing a lot of work in that sentence: these are the patterns that show up most often, not guarantees. The strength of the event, where the warmest water sits, and what other climate patterns are doing at the same time can all shift the details.
Region | Typical El Niño effect | Typical La Niña effect |
|---|---|---|
Indonesia and Southeast Asia | Drier than usual, drought and fire risk | Wetter than usual, flood risk |
Northern and eastern Australia | Drier and hotter, drought risk | Wetter than usual, flood risk |
Peru and Ecuador | Much wetter, floods and mudslides | Drier than usual |
Southern United States | Wetter and cooler winter | Drier and warmer winter |
Northern United States and Canada | Warmer winter | Colder and stormier winter |
Southern Africa | Drier than usual, drought risk | Wetter than usual |
Horn of Africa | Wetter than usual | Drier than usual, drought risk |
South Asia (monsoon) | Weaker monsoon, less rain | Stronger monsoon, more rain |
6.4 Why the same event feels different in different places
Two towns in the same country can experience the same El Niño very differently, because teleconnections interact with mountains, coastlines and local wind patterns. A coastal city may get more rain while a valley a hundred kilometres inland stays dry. A country may be wetter on average while one farming district suffers drought. That is why national forecasts are only a starting point, and why local forecasters and agricultural advisers translate the global ENSO outlook into regional guidance.
It is also why the phrase "El Niño causes drought" is too simple. El Niño changes the odds. It makes drought more likely in some places and less likely in others, but it does not determine the weather on any given day. A wet week can still happen in a dry El Niño season, and a dry spell can still happen in a wet La Niña season. The honest statement is about probabilities, and the honest forecast gives numbers, not certainties.
6.5 The global temperature signal
El Niño years are, on average, warmer globally than La Niña years, because the warm Pacific releases heat into the atmosphere. The strongest El Niño years have repeatedly set global temperature records — 1998 after the 1997–98 event, and 2016 after the 2015–16 event. La Niña years are cooler by comparison, though the cooling is modest, typically a tenth or two of a degree in the global average.
That tenth of a degree matters more than it sounds. It is enough to shift the ranking of warm years, to change the odds of heatwaves in some regions, and to confuse anyone who looks at a single year in isolation. A cool La Niña year in a warming world can still be warmer than a warm El Niño year from a generation ago. The long-term trend and the ENSO cycle sit on top of each other, and both need to be read together.
For a broader picture of how the long-term warming trend interacts with natural cycles like ENSO, see our guide to climate change.
7. Hurricanes, Monsoons and the Seasons
ENSO does not only change where rain falls. It changes the winds that storms need, the moisture that monsoons carry, and the temperature of the seasons themselves. This section looks at three of the most consequential links: Atlantic hurricanes, the South Asian monsoon, and winter weather in North America.
7.1 Atlantic hurricanes: the wind shear link
A hurricane needs warm ocean water, moist air and, crucially, low wind shear — that is, winds that do not change much with height. If the wind at the top of a developing storm blows much faster than the wind at the bottom, the storm is torn apart before it can organise.
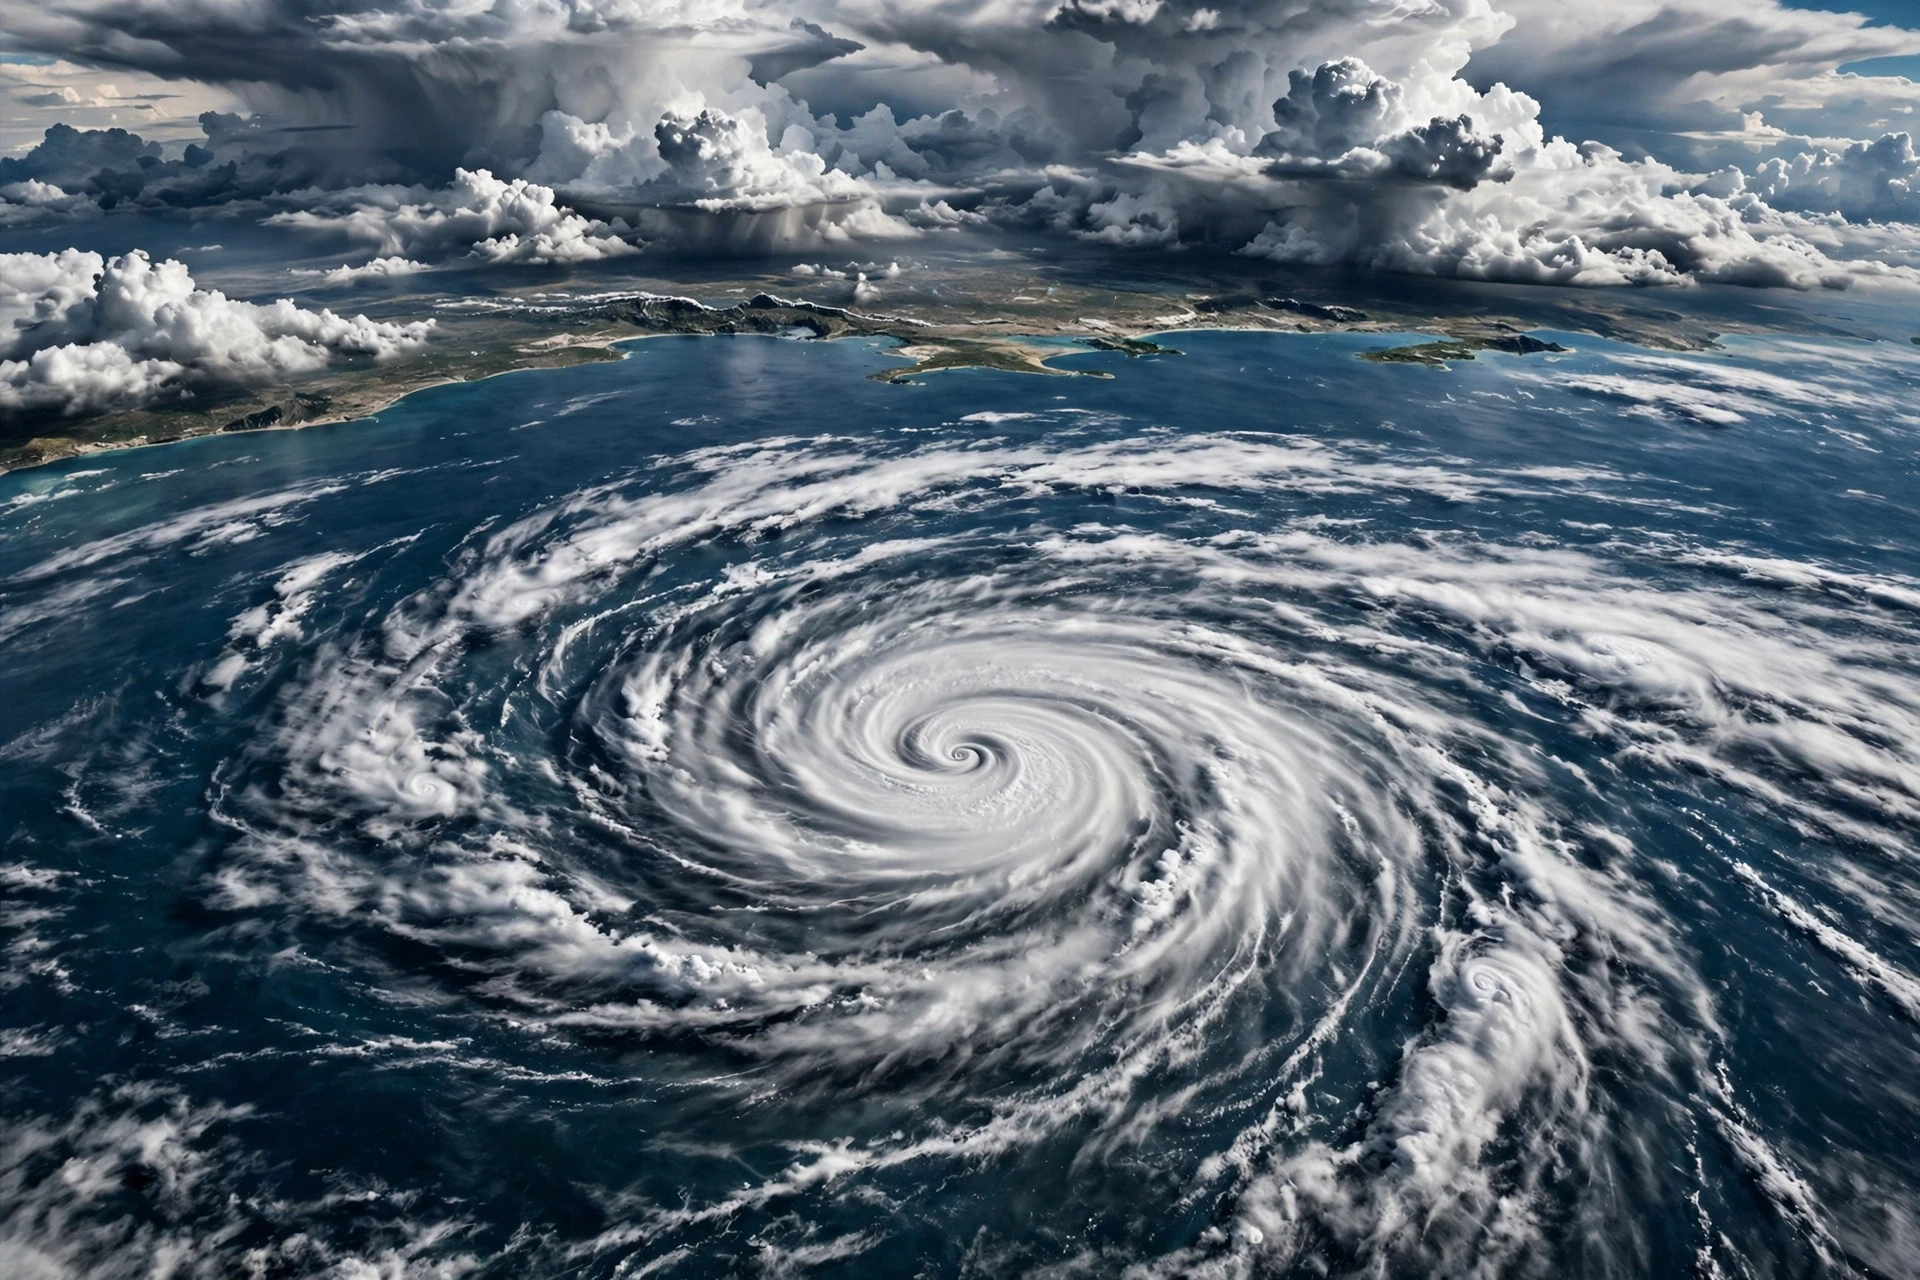
El Niño increases wind shear over the tropical Atlantic. The mechanism runs through the atmosphere: the shifted rising air over the Pacific changes the high-level winds downstream, and those winds blow across the Atlantic at exactly the height where they can disrupt young hurricanes. The result is that El Niño years tend to have fewer Atlantic hurricanes, and the ones that do form tend to be weaker.
La Niña does the opposite. It reduces wind shear over the Atlantic, giving storms a cleaner environment in which to grow. La Niña years are often busy Atlantic hurricane seasons, with more named storms and more major hurricanes. The 2020 season, during the triple-dip La Niña, was so active that forecasters ran through the entire alphabet of storm names and had to use Greek letters for the rest. The 2021 and 2022 seasons were busy too.
There is a twist. While El Niño suppresses Atlantic hurricanes, it tends to favour hurricanes in the eastern and central Pacific, where the warmer water and reduced shear help storms form closer to Hawaii and Mexico. So the same event can mean a quiet Atlantic and a busy Pacific at the same time. Anyone who lives on a coast needs to know which ocean matters to them.
El Niño does not cancel hurricane season. It shifts the odds — fewer storms in the Atlantic, more in the Pacific — and a single storm can still cause enormous damage in a quiet year.
7.2 The South Asian monsoon
The South Asian monsoon is the largest seasonal rainfall system on Earth, watering the crops that feed more than a billion people. Its strength depends on the temperature contrast between the Asian landmass and the Indian Ocean, but ENSO can tip the balance. During El Niño, the shifted Walker circulation tends to bring sinking air over South Asia, weakening the monsoon and reducing rainfall. The 2015 monsoon, during a strong El Niño, was notably weak, and parts of India suffered drought. During La Niña, the monsoon tends to be stronger, with more rain.
The link is not ironclad — the Indian Ocean has its own dipole pattern that can reinforce or counteract ENSO — but it is strong enough that Indian forecasters watch the Pacific closely every spring, and farmers make planting decisions based in part on the ENSO outlook. For a country where the monsoon is the difference between a good harvest and a failed one, a shift in the odds is a matter of national importance.
7.3 Winter in North America
In North America, ENSO's fingerprint is clearest in winter. During El Niño, the southern United States tends to be wetter and cooler, because the subtropical jet stream — a fast river of air high in the atmosphere — shifts southward and steers storms across the south. The northern United States and Canada tend to be warmer, because the jet stream's northern branch stays farther north. During La Niña, the pattern largely reverses: the north tends to be colder and stormier, and the south tends to be drier and warmer.
These are tendencies, not rules, and they are strongest in the strongest events. A weak El Niño may leave barely a trace on a North American winter, while a strong one can dominate it. Ski resorts, energy companies, water managers and farmers all use the ENSO outlook to plan, because a shift in winter temperature and snowfall changes demand for heating, the timing of snowmelt and the water available for the following summer.
7.4 Seasons in the southern hemisphere
In the southern hemisphere, ENSO's effects are felt most in the austral summer, which is the rainy season in much of Australia, southern Africa and South America. An El Niño summer in eastern Australia often brings heatwaves and bushfire risk; a La Niña summer often brings floods. In southeastern South America, El Niño tends to bring more rain, while La Niña tends to bring less. In southern Africa, the pattern is similar to Australia's: El Niño dries, La Niña wets.
8. Forecasting El Niño and La Niña
Forecasting ENSO is one of the great successes of modern climate science — and one of its most honest limitations. We can now predict an El Niño or La Niña months before it peaks, with enough skill to be genuinely useful. We cannot predict it a year ahead with the same confidence, and we cannot say exactly how strong it will be, or exactly where its effects will land. That gap between what we can do and what we wish we could do is where the science is most interesting.
8.1 The observing system: buoys, floats, satellites and ships
The foundation of every ENSO forecast is observation. The centrepiece is an array of moored buoys strung across the equatorial Pacific, which measure sea-surface temperature, wind, air temperature and humidity, and the temperature of the water below the surface. The array is maintained by NOAA and its partners, and it gives forecasters a real-time picture of what the ocean is doing, including the subsurface warm water that is the best early warning of an El Niño.
Around the buoys sits a larger system: thousands of drifting floats that sink and rise through the ocean measuring temperature and salinity, satellites that measure sea-surface temperature and sea level across the whole basin every day, and commercial ships and research vessels that take measurements as they cross. NASA's Earth Observatory explains how satellite data reveals El Niño's signature from space, and its images of the 1997–98 and 2015–16 events remain some of the clearest visual records of the phenomenon (NASA Earth Observatory).
I once visited a laboratory where a technician was calibrating a buoy sensor in a tank of water, checking it against a reference thermometer with the patience of someone defusing a bomb. "If this reads half a degree wrong," she said, "the whole Pacific looks wrong." It was a small reminder that the global forecast rests on careful, unglamorous work, one sensor at a time.
8.2 How the models work
Forecasters feed the observations into computer models of the coupled ocean and atmosphere — models that simulate the trade winds, the thermocline, the Walker circulation and the feedbacks between them. There are two main kinds. Statistical models look for patterns in the past: when the ocean looked like this before, what happened next? Dynamical models simulate the physics directly, stepping the equations of fluid motion forward in time on supercomputers.
Neither kind is perfect, and they disagree with each other more often than forecasters would like. That is why the official forecasts are built from an ensemble — many models run together, and the forecast is the average of their predictions, with a spread that shows the uncertainty. When the models agree, confidence is high. When they spread out, confidence is low, and the forecast says so.
NOAA's Climate Prediction Center publishes a monthly ENSO discussion that summarises the observations, the model forecasts and the official outlook, and it is the single most useful public source for anyone following the cycle (NOAA Climate Prediction Center ENSO discussion). The International Research Institute for Climate and Society at Columbia University also publishes a well-regarded ENSO forecast and explains the science behind it (IRI Columbia).
8.3 The spring predictability barrier
There is a well-known difficulty in ENSO forecasting called the spring predictability barrier. Forecasts made in the northern hemisphere spring, for the following winter, are less skilful than forecasts made in summer or autumn. The reason is that the Pacific is at its most changeable in spring: the trade winds are weak, the thermocline is shallow, and small disturbances can grow into large ones. A forecast made in April can look very different from a forecast made in July, even though both are aiming at the same winter.
This is not a failure of the models. It is a property of the system, and forecasters are open about it. The practical lesson is to treat spring forecasts as early signals, not final answers, and to update plans as the forecast sharpens through the summer. Anyone who makes a decision based on a spring ENSO forecast alone — a farmer choosing a crop, a water manager setting reservoir levels — should be making a decision that can be revised.
8.4 What a forecast can and cannot tell you
A good ENSO forecast can tell you, months ahead, that an El Niño is likely, and roughly how strong it may be. It can tell you that the odds of a dry season in Indonesia have risen, or that the Atlantic hurricane season is likely to be quieter than usual. What it cannot tell you is whether it will rain on your farm on a particular week, or whether a hurricane will hit your city. ENSO shifts the odds; local weather still decides the outcome.
That distinction is the hardest part of communicating forecasts, and it is where misunderstandings grow. When a forecast says "El Niño is coming" and then a wet week arrives in a region that was supposed to be dry, people conclude the forecast was wrong. It was not wrong; it was probabilistic, and the wet week was part of the spread. Forecasters are learning to communicate this better, with maps that show probabilities rather than single outcomes, and with language that says "more likely" instead of "will".
8.5 Why early warning matters
The value of an ENSO forecast is measured in what people do with it. A farmer who knows a dry season is likely can plant a drought-tolerant crop, or plant earlier, or store water. A government that knows a drought is coming can pre-position food aid, rather than waiting for the harvest to fail. A health service that knows a wet season is coming can prepare for the mosquito-borne diseases that follow flooding. An energy company can plan for higher demand for heating or cooling.
None of this requires a perfect forecast. It requires a forecast that is good enough, early enough, and communicated clearly enough to act on. ENSO forecasting has crossed that threshold for many of the world's most vulnerable regions, and the work now is to make the forecasts more local, more timely and more trusted — so that the warning reaches the people who need it, in a form they can use.
9. El Niño, La Niña and a Warming Climate
The question everyone asks next is the obvious one: what does climate change do to ENSO? It is also one of the hardest questions in climate science, because ENSO is a natural cycle that has existed for thousands of years, and the warming of the last century is layered on top of it. Separating the two is difficult, and scientists are honest about the uncertainty.
9.1 What we know: the ocean is warming
The tropical Pacific, like the rest of the ocean, has warmed over the past century. The warm pool has expanded, and the surface waters of the eastern Pacific are warmer now than they were during comparable events in the past. That means an El Niño today starts from a warmer baseline than an El Niño fifty years ago, and its warmest waters are warmer still. It also means a La Niña today, though cooler than average, is warmer in absolute terms than a La Niña from a generation ago.
The warming also changes the atmosphere above the ocean. Warmer air holds more water vapour — roughly seven percent more for each degree of warming — so when it does rain, it can rain harder. That is one reason the floods associated with recent El Niño events have been so destructive: the same shift in the circulation now delivers more water.
9.2 What we do not know yet: will ENSO get stronger?
Whether ENSO itself will become stronger, weaker or more frequent as the climate warms is still an open question. Climate models disagree. Some project stronger El Niño events, with more extreme rainfall in the eastern Pacific. Others project little change in the strength of the cycle, but a change in its impacts, because the warmer background makes the same event wetter. A few project a shift toward more central Pacific events, which would change the pattern of teleconnections.
What the models do agree on, broadly, is that the impacts of ENSO are likely to grow even if the cycle itself does not, because the warmer, moister atmosphere amplifies the rainfall extremes that ENSO already produces. A wet El Niño is likely to get wetter; a dry El Niño is likely to get drier in the places it already dries. That is a sobering prospect for the regions that already live with the sharpest end of the cycle.
9.3 The record in corals and sediments
How do we know ENSO existed before thermometers? The evidence is written in nature's own archives. Corals in the tropical Pacific lay down growth bands that record the temperature and chemistry of the water they grew in, year by year, for centuries. Lake sediments in South America record the floods that El Niño brought. Tree rings in the American southwest record the wet winters that El Niño favoured. Together they show that ENSO has been swinging for at least thousands of years, through warm periods and cool ones, long before human industry added greenhouse gases to the air.
9.4 Preparing for a warmer ENSO future
Whatever the models eventually settle on, the practical response is the same: build resilience to the ENSO we already have. That means water systems that can store water in wet years and ration it in dry ones, farming systems that can cope with both drought and flood, early-warning systems that reach the people most at risk, and insurance and aid systems that pay out quickly when the forecast turns bad.
It also means watching the Pacific. The observing system that makes ENSO forecasts possible is not free, and it is not automatic. Buoys need maintenance, satellites need replacing, and the scientists who interpret the data need support. Every time the system is allowed to degrade, the world loses a little of its ability to see the next event coming. Given what is at stake, that is a poor bargain.
10. Common Misconceptions About El Niño and La Niña
Most people assume El Niño is simply "bad weather" and La Niña is simply "good weather", or the other way around. What the data actually show is that neither phase is good or bad in itself. Each brings rain to some places and drought to others, and whether an event helps or harms you depends almost entirely on where you live and what you do. A wet El Niño is a blessing for a farmer in Peru and a disaster for a farmer in Indonesia, in the same months, from the same ocean.
10.1 "El Niño causes global warming"
This is the most common confusion, and it is understandable. El Niño years are warmer globally, and the strongest El Niño years have set temperature records. But El Niño does not create heat; it moves heat that is already in the ocean into the atmosphere. The long-term warming trend is driven by greenhouse gases trapping heat in the climate system. El Niño is a rearrangement of heat, not a source of it. When an El Niño ends, much of that heat is taken back up by the ocean. The trend stays; the cycle comes and goes.
10.2 "La Niña means a cold winter everywhere"
La Niña cools the global average slightly, and it does bring colder winters to the northern United States and Canada. But it brings warmer, drier winters to the southern United States, and its effects in Europe and Asia are weak and inconsistent. A La Niña winter in London or Tokyo may be entirely unremarkable. The Pacific's reach is long, but it is not unlimited, and some regions sit outside its main teleconnections.
10.3 "We can predict El Niño a year ahead"
We can see the early signs of an event several months ahead, and forecasts for the coming winter made in summer are often skilful. Forecasts made a year ahead are not. The spring predictability barrier, the chaos of the system and the limits of the observing network all conspire against long-lead forecasts. Anyone offering a confident prediction of the El Niño two winters from now is selling certainty the science does not have.
10.4 "El Niño and La Niña are new"
They are not. Fishermen named El Niño centuries ago, and the coral and sediment records show the cycle operating for thousands of years. What is new is our ability to observe it from space, to forecast it with models, and to measure its impacts in real time. The phenomenon is old; the science is young.
10.5 "One El Niño is like another"
No two events are alike. They differ in strength, in where the warmest water sits, in how long they last, and in what other climate patterns are doing at the same time. The 1997–98 and 2015–16 events were both very strong, but their effects differed in detail. Treating every El Niño as a copy of the last one is a shortcut that leads to bad decisions.
The Pacific will keep swinging between warm and cool, wet and dry, for as long as the trade winds blow and the ocean stores heat. The cycle cannot be stopped, and it should not be feared as a whole. It can be understood, forecast and prepared for — and the more people understand it, the less damage it does. The next time rain falls in a desert, or a hurricane season turns busy, or a monsoon arrives weak, look to the equator. The answer is very often there, in a stretch of ocean wider than a continent, quietly setting the weather for the world.
Frequently Asked Questions
What is El Niño in simple terms?
El Niño is the warm phase of a natural climate cycle in the tropical Pacific. The trade winds weaken, warm water spreads eastward toward South America, and rainfall patterns shift worldwide, bringing floods to some regions and drought to others. It typically lasts nine to twelve months and peaks in the northern hemisphere winter.
What is La Niña in simple terms?
La Niña is the cool phase of the same cycle. The trade winds strengthen, warm water piles up in the west near Indonesia, and cold water wells up strongly off South America. It tends to bring wetter weather to Indonesia and Australia, drier weather to the southern United States, and busier Atlantic hurricane seasons.
How often do El Niño and La Niña happen?
The full cycle, called ENSO, typically takes three to seven years, with El Niño and La Niña events each lasting around nine to twelve months, separated by neutral periods. Some events last longer — the La Niña of 2020–23 lasted three winters — and the timing is irregular, which is why forecasts are given as probabilities.
How do scientists know an El Niño is coming?
They watch the tropical Pacific with moored buoys, drifting floats, satellites and ships, tracking sea-surface temperature, winds and the depth of warm water below the surface. Computer models of the coupled ocean and atmosphere turn those observations into forecasts, usually skilful several months ahead. NOAA's Climate Prediction Center publishes the official monthly outlook.
Does El Niño cause hurricanes?
El Niño does not cause hurricanes directly, but it changes the odds. It increases wind shear over the tropical Atlantic, which tends to suppress Atlantic hurricanes, while favouring hurricanes in the eastern and central Pacific. La Niña does the opposite, reducing Atlantic wind shear and often leading to busier Atlantic hurricane seasons.
Is El Niño caused by climate change?
No. El Niño and La Niña are natural cycles that have operated for thousands of years, long before human-caused warming. Climate change may alter how strong the events are and how severe their impacts feel, because a warmer ocean and a moister atmosphere can amplify floods and droughts, but the cycle itself is natural.
What is the difference between El Niño and La Niña?
El Niño warms the central and eastern tropical Pacific and weakens the trade winds, while La Niña cools the same region and strengthens the trade winds. Their weather effects are often opposite — for example, Indonesia tends to be dry during El Niño and wet during La Niña — but the mirror is not perfect, and the details depend on each event's strength and pattern.