

Introduction
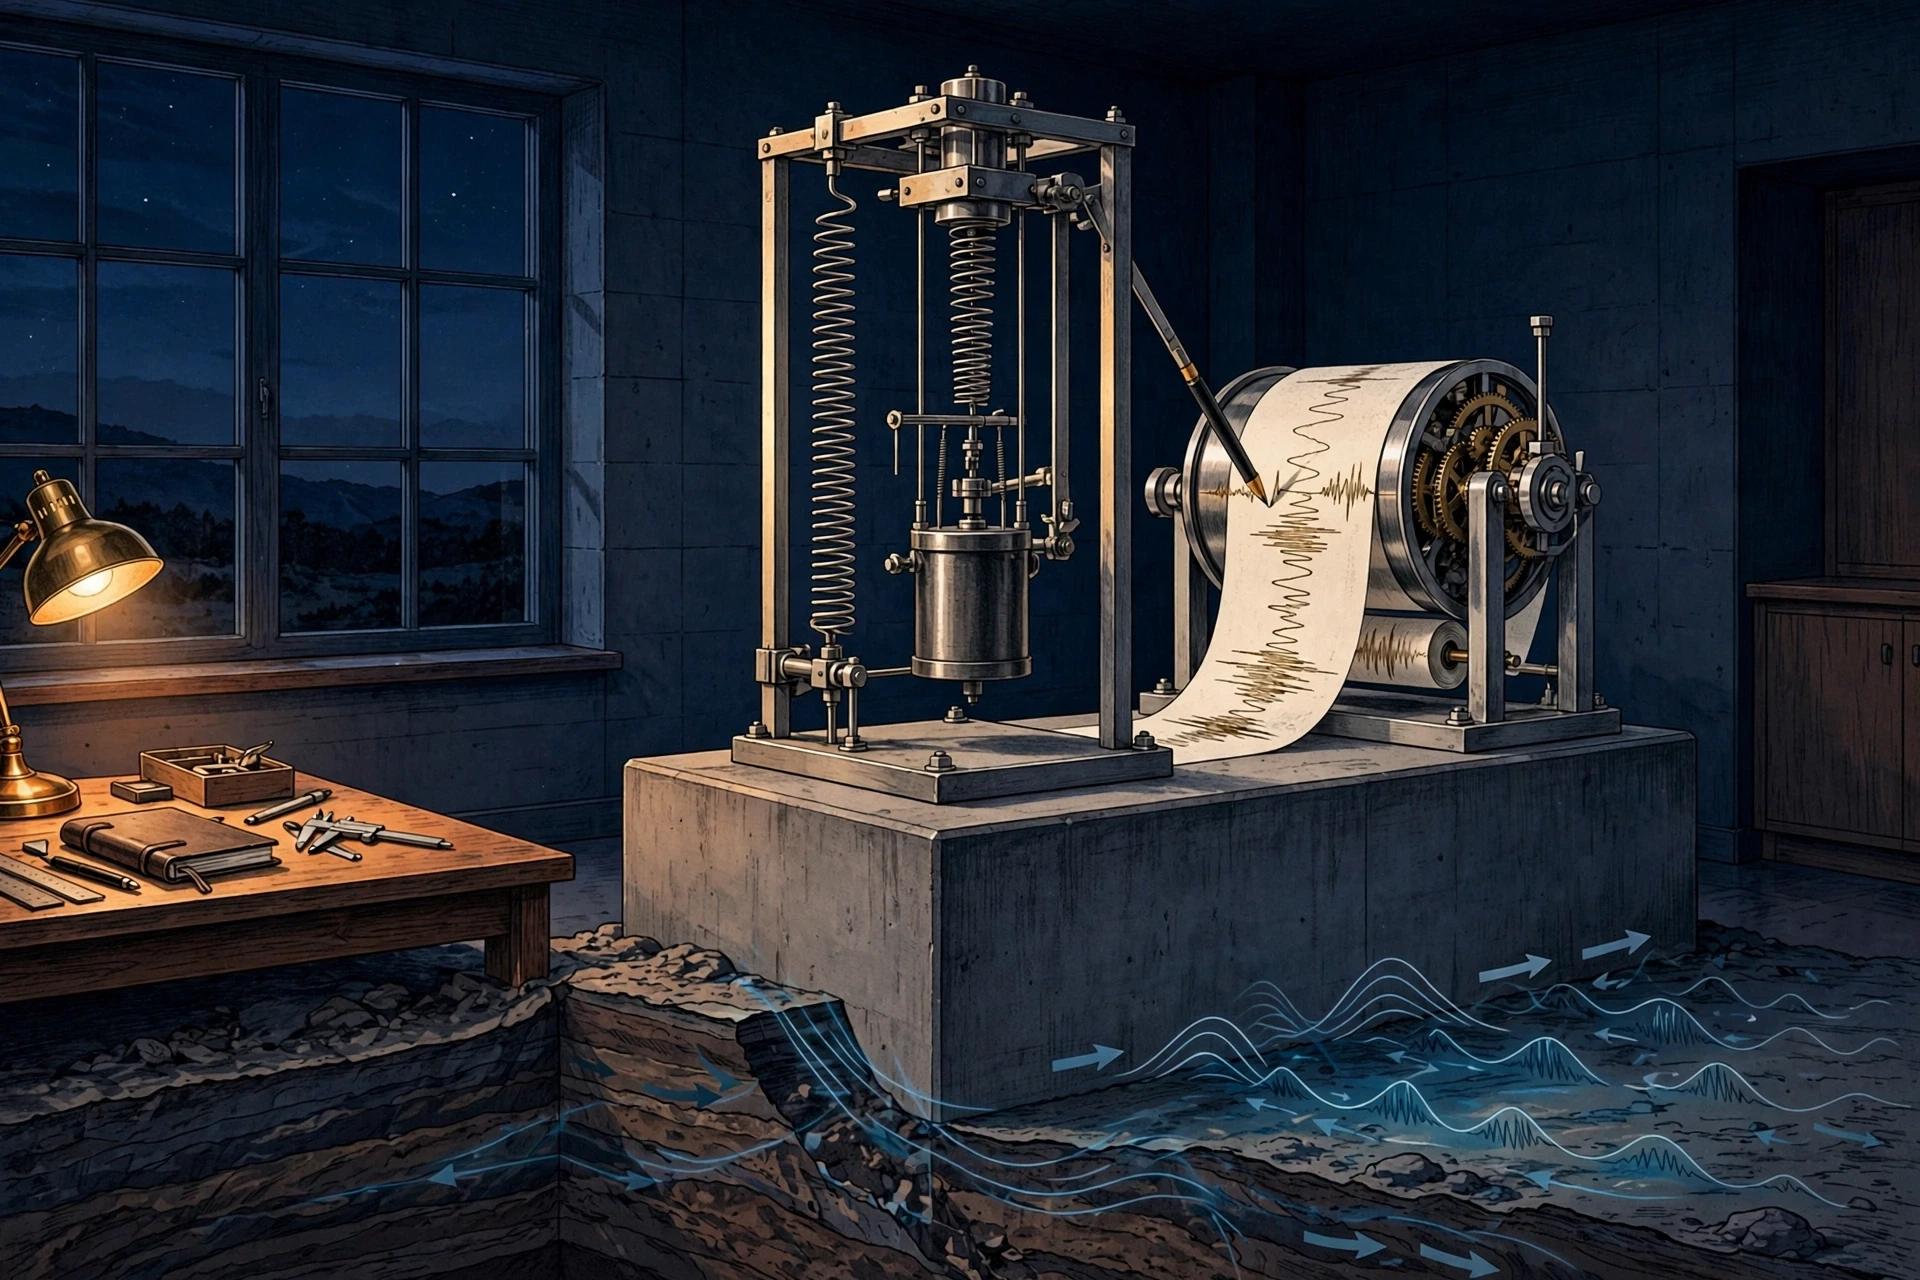
The first earthquake I ever felt did not announce itself. I was sitting at a lab bench late one evening, watching a seismograph pen trace its quiet, almost flat line across a slowly turning drum, when the line suddenly twitched. The pen jumped, steadied, then jumped again, harder, drawing a jagged mountain range across the paper in a matter of seconds. My first thought was that someone had bumped the table. My second thought — the one that stayed with me for the rest of my career — was that earthquakes move the ground under our feet, and a machine had caught one in the act. The quake was a modest one, hundreds of kilometres away, and nobody in the building felt a thing. But the instrument felt it. The Earth had spoken, and for the first time I understood that we live on a planet that is always, quietly, in motion.
Earthquakes are among the most powerful and least predictable events on Earth. In a few seconds, they can level cities, trigger tsunamis, and reshape coastlines. Yet the same forces that cause them also built the mountains we climb, the valleys we farm, and the continents we live on. This guide explains how earthquakes happen, from the slow grind of tectonic plates to the split-second snap of a fault, how seismic waves carry that energy across the planet, and how scientists measure, locate, and study quakes they can never see directly. It also explains what we still cannot do — predict the next big one — and why the science of listening to the Earth has never been more promising.
The story starts with a simple fact that still surprises people when they first hear it: the ground beneath you is moving right now. Not shaking — moving. The plate you are standing on is drifting, a few centimetres a year, about as fast as your fingernails grow. Most of the time, that motion is smooth and silent. But where plates meet, the edges can lock together, and when locked rock finally gives way, the stored energy is released all at once. That release is an earthquake.
1. What an Earthquake Really Is
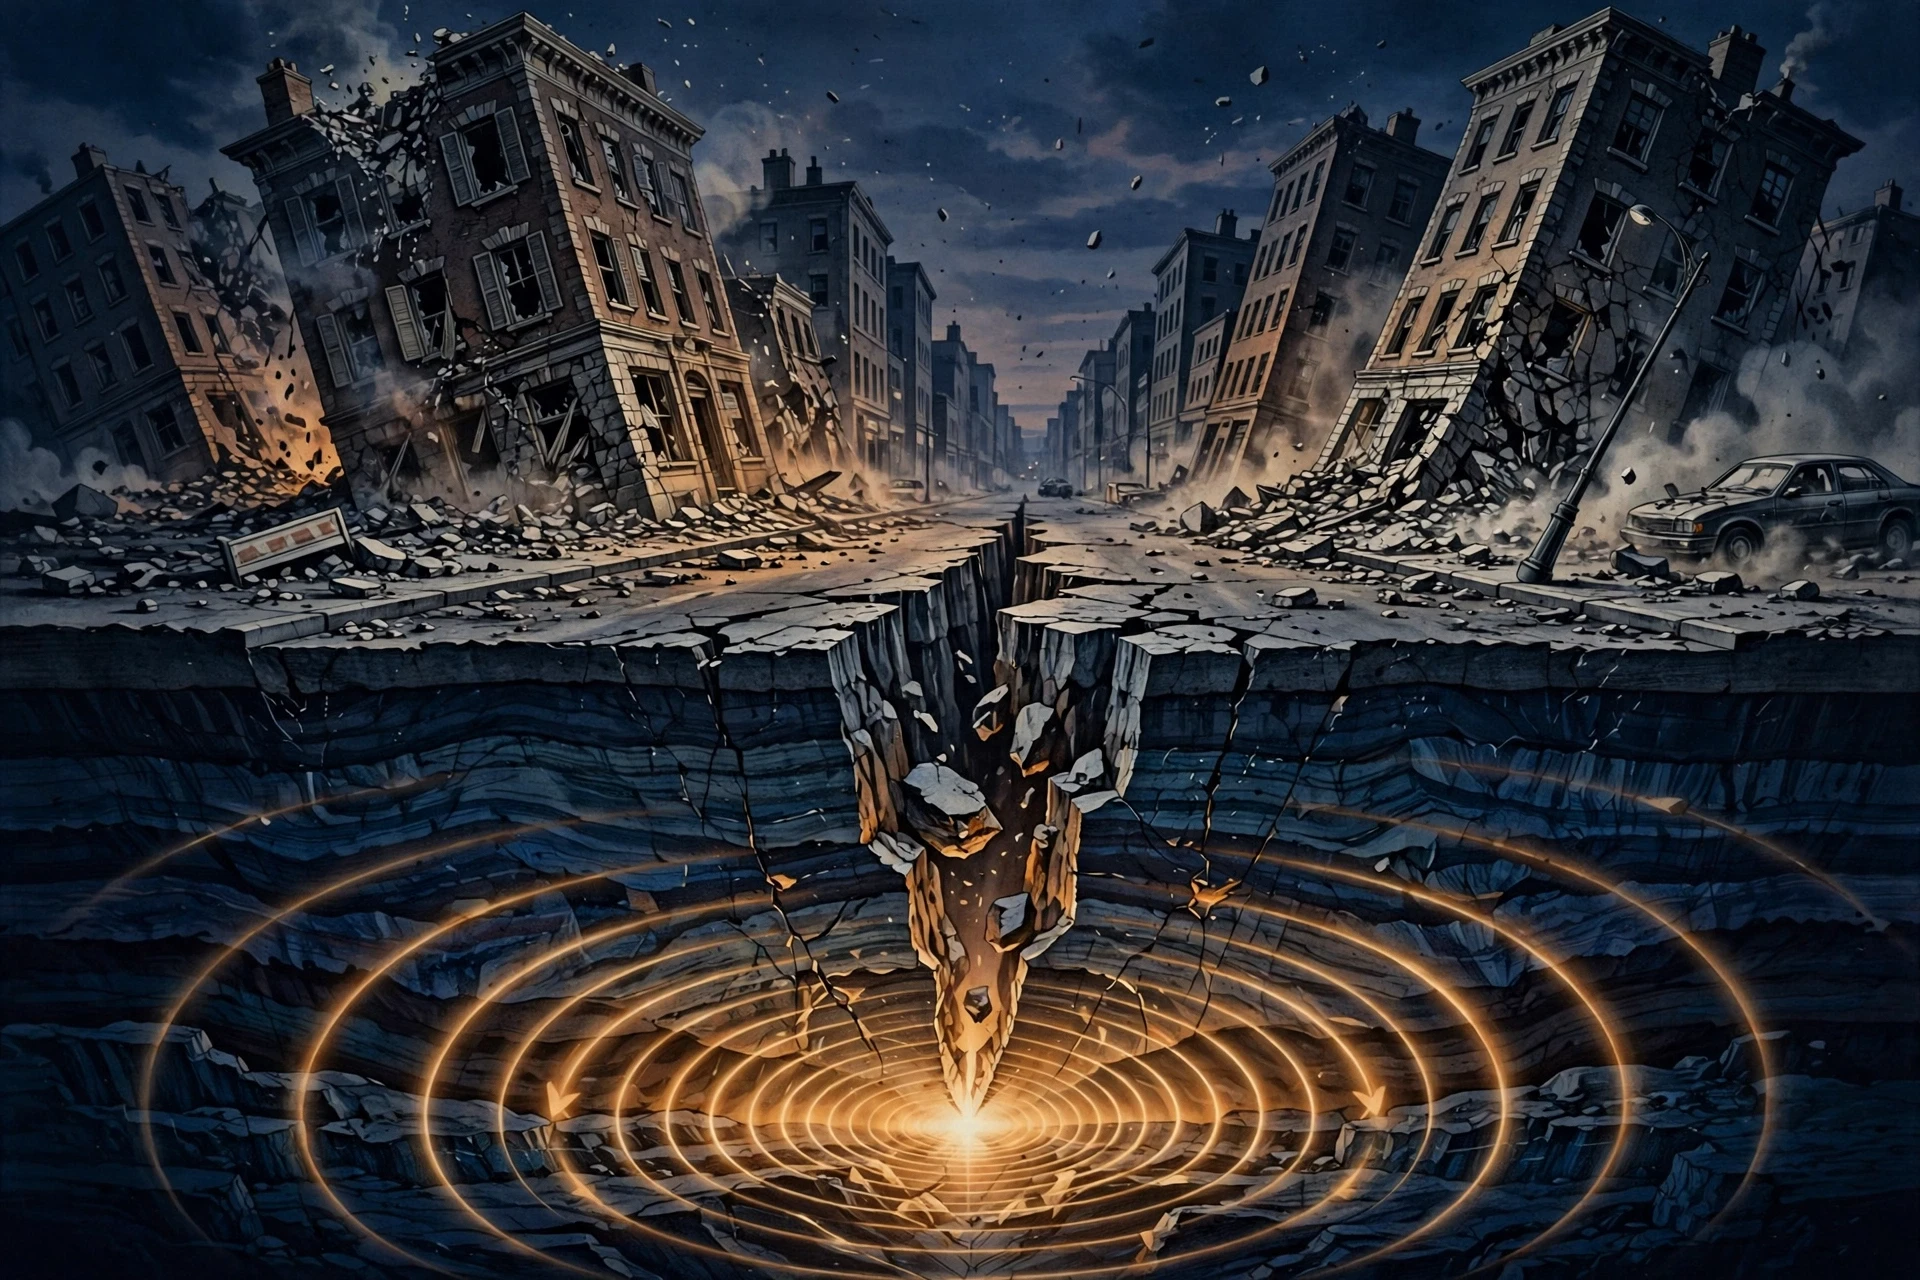
An earthquake is the sudden shaking of the ground caused by a rapid release of energy in the Earth's crust. That energy travels outward as seismic waves, and when those waves reach the surface, they shake the ground, the buildings on it, and everything in them. The US Geological Survey puts it plainly: an earthquake is what happens when two blocks of the Earth suddenly slip past one another, and the surface where they slip is called the fault, or fault plane. That definition is worth holding on to, because almost everything else in this guide is an elaboration of it: what the blocks are, why they slip, and how we read the waves they send out.
1.1 The fault, the hypocenter, and the epicenter
Three words do most of the work in seismology, and they are worth learning properly because they are mixed up constantly, even in news reports.
Fault: a fracture in the Earth's crust along which blocks of rock move relative to each other. Some faults are tiny cracks a few metres long. Others, like the San Andreas Fault in California, run for more than a thousand kilometres.
Hypocenter (or focus): the point underground where the earthquake rupture begins. This is where the slip starts, and it can be a few kilometres deep or several hundred kilometres down.
Epicenter: the point on the Earth's surface directly above the hypocenter. It is the place on the map where the quake is centred, and usually where the shaking is strongest — though not always, as we will see in Section 8.
The distinction matters. A quake with a hypocenter 600 kilometres deep will be felt over a huge area but may cause little damage, because its energy has spread and weakened by the time it reaches the surface. A shallow quake of the same size, with a hypocenter only 10 kilometres down, can be devastating. Depth is one of the first things seismologists look at when a new quake is located, and it is one reason why a single magnitude number never tells the whole story.
1.2 How common are earthquakes?
The numbers are startling. The USGS locates around 20,000 earthquakes every year — roughly 55 a day — and that is only the ones large enough for its global network to detect and locate. In reality, millions of earthquakes happen each year. Most are so small that only sensitive instruments notice them. About 100,000 are strong enough to be felt by people, and around 100 a year cause damage. The largest earthquakes ever recorded reach magnitude 9 and above, and they are rare: on average, the planet sees one magnitude 8 or larger quake per year, and a magnitude 9 roughly once a decade.
I keep a small ritual from my early fieldwork days. Every morning, before I check the news, I glance at the USGS earthquake map. Most days it shows a scatter of small dots around the Pacific, a few in the mid-Atlantic, the odd one in an unexpected place. It is a reminder that the Earth never really sits still. The map is not a list of disasters. It is a picture of a living planet, and most of those dots will never make a headline.
2. Why the Ground Moves: Tectonic Plates and the Slow Build-Up of Stress
The Earth's outer shell is not one solid piece. It is broken into a dozen or so large slabs, and many smaller ones, called tectonic plates. These plates float on the hot, slowly flowing rock of the mantle below, and they move — a few centimetres a year, driven by heat rising from the Earth's interior. The crust itself is rock, minerals assembled from the elements of the periodic table, and over long timescales it behaves less like solid stone and more like something that can bend, stretch, and finally snap. The heat itself is a leftover from the planet's formation, topped up by the slow decay of radioactive elements deep inside. Our Solar System formed from the same swirling material, and the energy of that violent birth is still leaking out of the Earth today, four and a half billion years later, as the engine of plate tectonics.
Where plates meet, their edges grind against each other. The edges are rough, like two pieces of sandpaper pressed together, and friction can lock them in place even while the rest of the plate keeps moving. Stress builds up along the locked boundary — slowly, silently, for decades or centuries — until the force finally overcomes the friction. Then the locked edge breaks free, the plates lurch into a new position, and the stored energy is released as seismic waves. That is the earthquake.
2.1 Three kinds of plate boundaries
Almost all large earthquakes happen at plate boundaries, and the kind of boundary decides the kind of quake.
Convergent boundaries — plates collide. One plate is forced beneath the other in a process called subduction. These boundaries produce the largest earthquakes on Earth, including the magnitude 9.5 Valdivia earthquake in Chile in 1960, the biggest ever recorded, and the 2011 Tohoku earthquake in Japan. The plates can lock for centuries and then slip by tens of metres in minutes.
Divergent boundaries — plates pull apart. New crust forms as magma rises to fill the gap, as along the Mid-Atlantic Ridge. The earthquakes here are usually smaller and shallower, because the crust is thin and hot, and it stretches rather than locking hard.
Transform boundaries — plates slide past each other. The San Andreas Fault is the famous example. The plates grind sideways, lock, and then slip. These faults can produce very large, damaging quakes in places where millions of people live, which is why California's earthquake science is among the most advanced in the world.
There is also a rarer category: earthquakes that happen far from any plate boundary, in the middle of a plate. These intraplate quakes are less common but can be severe, because buildings in regions that rarely shake are often not built for it. The 1811–1812 New Madrid earthquakes in the central United States, which rang church bells in Boston and briefly reversed the flow of the Mississippi River, are the classic example. They are a reminder that "safe" is a relative word in seismology.
2.2 Elastic rebound: the spring that snaps
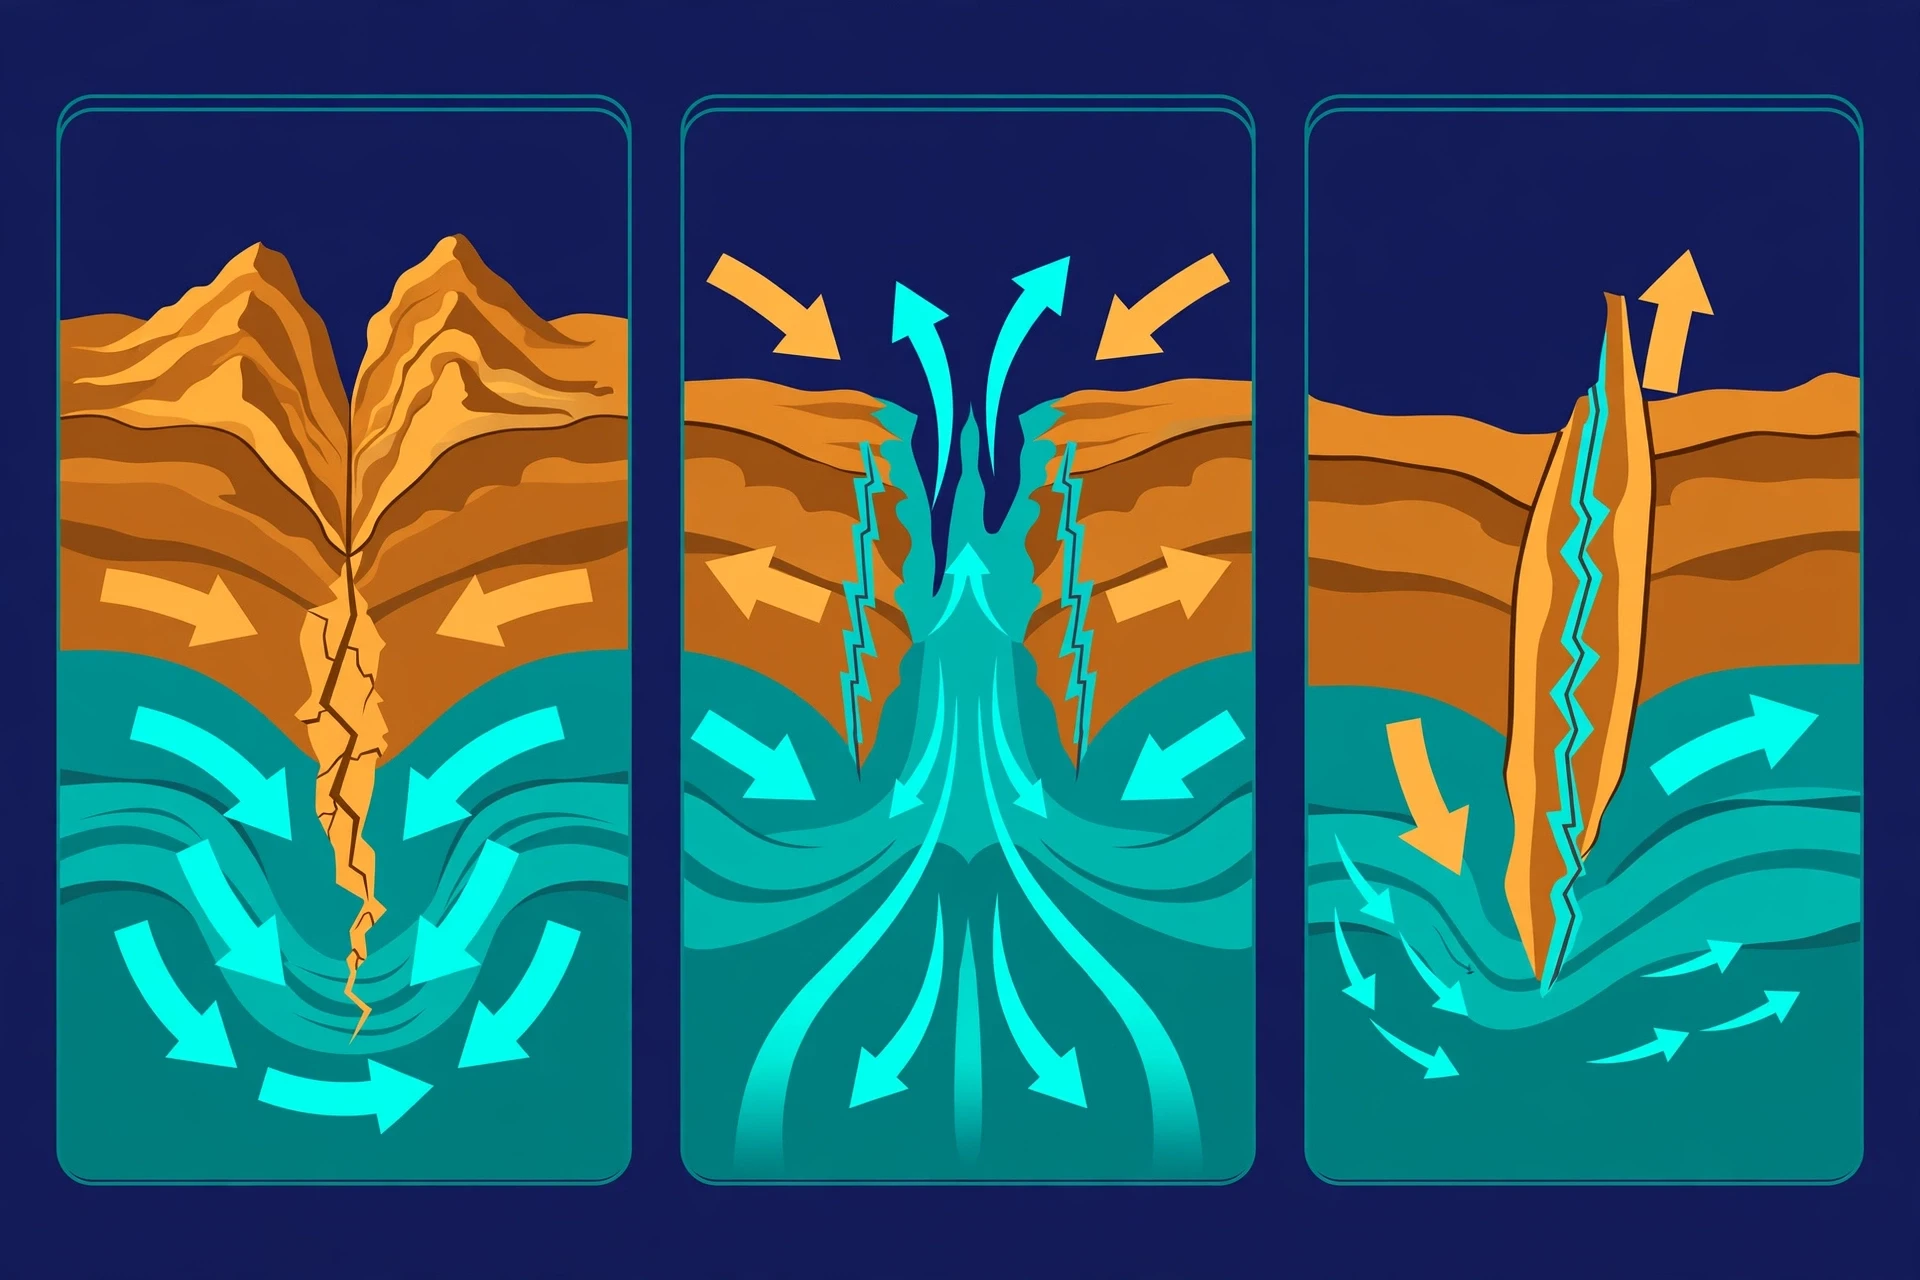
The idea that explains how stress becomes an earthquake is called elastic rebound theory, and it was worked out by Harry Fielding Reid after the great San Francisco earthquake of 1906. Reid studied the ground displacement along the San Andreas Fault and realised that the rocks on either side had been slowly bending, like a bow being drawn, for years before the quake. When the fault finally ruptured, the bent rocks snapped back toward their undeformed shape — the bowstring released — and the energy of that rebound radiated outward as seismic waves.
The best everyday analogy is a rubber band, or a stick bent between your hands. Bend it slowly and it stores energy. Bend it a little more and it stores more. Then it breaks, and all that stored energy comes out at once. The Earth's crust behaves the same way, except the bending takes decades and the break can run for hundreds of kilometres along a fault in under a minute.
I use the rubber band in teaching, and I have learned to be careful with it. The first time I demonstrated it to a class, I pulled too hard, the band snapped, and a piece of it hit the ceiling. The students laughed, but the point landed better than any slide I had prepared: the energy is invisible while it builds, and violent when it lets go. That is exactly the problem with earthquakes. The build-up is silent. There is no creaking, no visible warning. The crust gives no press conference before it breaks.
3. The Many Ways an Earthquake Can Start
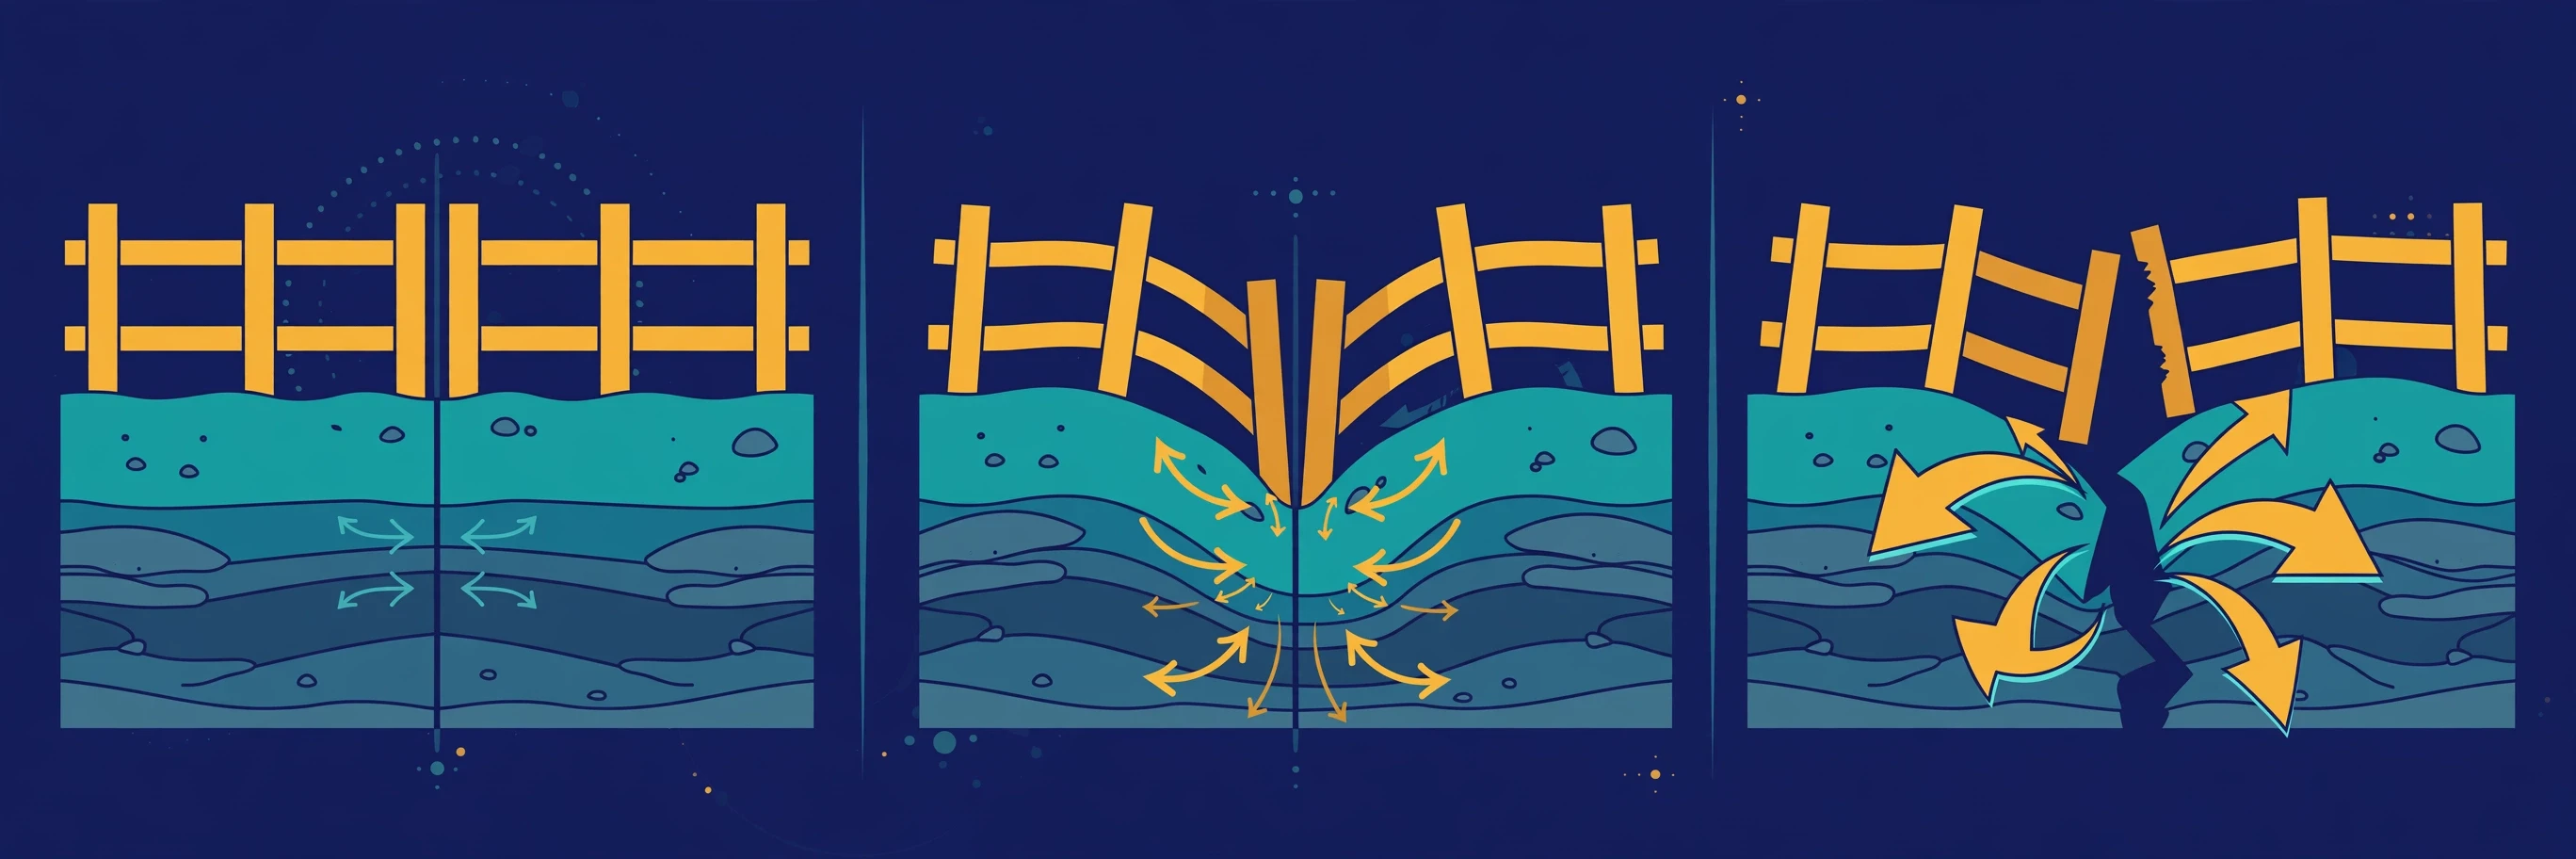
Most earthquakes are tectonic — caused by plate movement along faults. But they are not the only kind, and the exceptions teach us a lot about how the Earth works.
3.1 Tectonic, volcanic, collapse, and explosion quakes
Seismologists classify earthquakes by their cause, and Caltech's Science Exchange gives the clearest short summary of the four main types:
Tectonic earthquakes are the most common and the most powerful. They are caused by the sudden slip of rock along a fault, driven by plate motion. Nearly every damaging earthquake in history belongs in this category.
Volcanic earthquakes happen alongside volcanic activity, as magma forces its way upward through rock, cracking it and shaking the ground. These quakes are often small, but they are closely watched, because swarms of volcanic quakes can signal that an eruption is coming. The link between shaking ground and rising magma is one reason volcanologists and seismologists work side by side — and why our guide to Volcanoes: How They Form, Types, and Eruptions Explained covers the same restless forces from the other side.
Collapse earthquakes are small quakes caused by the underground collapse of caverns or mines. They are local and rarely dangerous beyond the collapse itself, but seismometers record them all the same.
Explosion earthquakes are caused by underground explosions, whether from nuclear tests or chemical blasts. Seismologists can usually tell these apart from natural quakes by the pattern of their waves — a skill that matters for monitoring nuclear test-ban treaties around the world.
3.2 Induced earthquakes: when human activity shakes the ground
Humans can cause earthquakes too, and this is one of the fastest-growing areas of seismology. Injecting wastewater deep underground, as is done in some oil and gas operations, can raise the pressure in rock pores and reduce the friction holding a fault locked. The fault then slips earlier than it otherwise would have. Fracking itself — hydraulic fracturing to release oil and gas — occasionally triggers small quakes, but the larger concern, as Caltech notes, is the disposal of wastewater in deep wells, which has measurably increased earthquake activity in parts of the central United States.
This is not a reason for panic, and it is not a reason for dismissal either. The magnitudes involved are usually small, but the lesson is important: the crust is a system under stress, and we are now part of that system. Geothermal energy projects, reservoir filling behind large dams, and mining all interact with the same physics. Understanding induced seismicity is now a practical question for engineers and regulators, not just an academic one.
3.3 Foreshocks, mainshocks, and aftershocks
Earthquakes rarely come alone. The USGS explains the sequence with three plain terms:
Foreshocks are smaller earthquakes that happen in the same place before a larger one. Scientists can only call them foreshocks after the fact — there is no way to know, in the moment, whether a small quake is a foreshock or just a small quake.
The mainshock is the largest earthquake in the sequence.
Aftershocks are smaller quakes that follow the mainshock in the same area, as the crust adjusts to its new position. Depending on the size of the mainshock, aftershocks can continue for weeks, months, and even years.
The 2011 Tohoku earthquake was preceded by a magnitude 7.2 foreshock two days earlier. At the time, nobody knew a magnitude 9.1 was coming. That is the cruel arithmetic of foreshocks: they are only recognisable in hindsight. Aftershocks, by contrast, are expected, and they are dangerous in their own right — they can collapse buildings weakened by the mainshock, and they keep rescue teams and residents on edge for a long time after the worst shaking has passed.
4. Seismic Waves: The Earth's Messengers
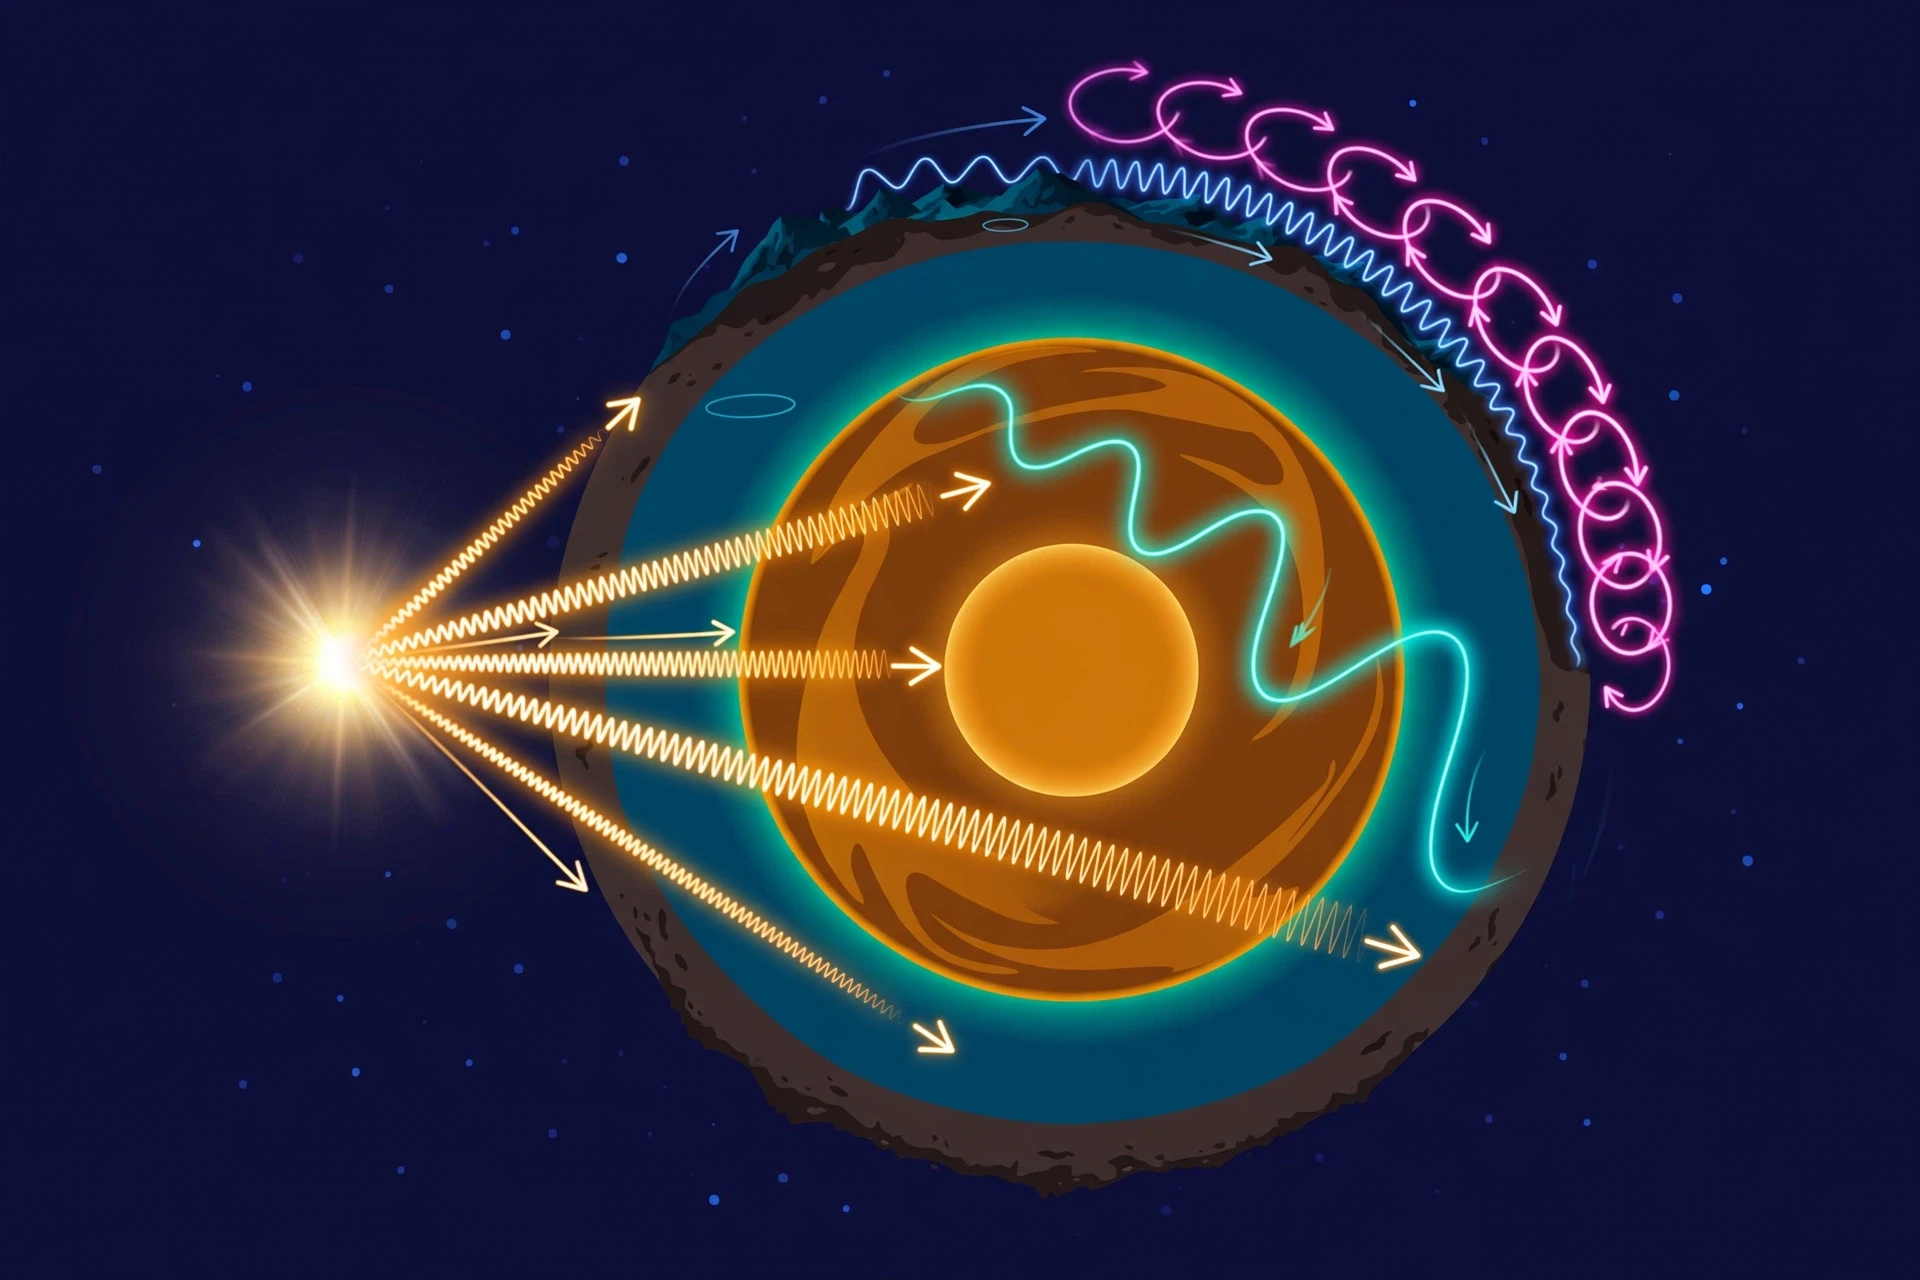
When a fault slips, the released energy does not stay put. It radiates outward in all directions as seismic waves — vibrations that travel through the Earth and along its surface, like ripples on a pond after a stone is dropped. These waves are the whole science of seismology. They are what we feel as shaking, what our instruments record, and — remarkably — what has taught us most of what we know about the inside of the Earth, a place no human will ever visit directly.
4.1 Body waves: P waves and S waves
The first waves to leave the hypocenter travel through the body of the Earth. They are called body waves, and there are two kinds.
P waves, or primary waves, are the fastest seismic waves. They move by squeezing and stretching the rock in the same direction the wave travels — a push-pull motion, much like sound waves moving through air. Because they are the fastest, P waves are the first to arrive at any seismograph, and they can travel through solids, liquids, and gases. In the crust they move at roughly 6 kilometres per second. A P wave from a quake 600 kilometres away arrives in under two minutes.
S waves, or secondary waves, are slower — about 60 percent as fast as P waves — and they move differently. They shear the rock from side to side, or up and down, at right angles to the direction of travel, like shaking a rope. S waves cannot travel through liquids, because liquids have no shear strength: you cannot shear water the way you can shear a solid. That single fact is one of the greatest discoveries in Earth science. When seismologists found that S waves disappear in a zone on the far side of the planet from an earthquake — the S-wave shadow zone — they had proof that the Earth's outer core is liquid. We learned the state of matter 2,900 kilometres below our feet from waves we could not see, recorded on instruments on the other side of the world.
The USGS uses a homely comparison that I have borrowed for years: P waves are like lightning and S waves are like thunder. You see the lightning first, then the thunder follows. The farther away the storm, the longer the gap. In exactly the same way, the gap between the arrival of the P wave and the S wave tells a seismologist how far away the earthquake was. That gap is the key to locating every earthquake on the planet, and we will come back to it in Section 5.
4.2 Surface waves: Love waves and Rayleigh waves
When body waves reach the surface, they generate a second family of waves that travel along the Earth's surface rather than through it. Surface waves are slower than body waves, but they are usually the largest and longest-lasting waves on a seismogram, and they cause most of the damage in a large earthquake.
Love waves move the ground from side to side, horizontally and at right angles to the direction of travel. They are fast for surface waves, and their sideways shaking is especially hard on buildings.
Rayleigh waves roll the ground in a vertical, elliptical motion — like ocean waves, but in solid earth. If you have ever stood on a beach and watched a wave roll toward you, you have a good picture of a Rayleigh wave, except that the "water" is the ground under a city.
The 1985 Mexico City earthquake is the classic lesson in surface waves. The quake itself happened far away, off the Pacific coast, but the soft lake-bed sediments under Mexico City trapped and amplified the surface waves, shaking the city far harder than the distance suggested. Buildings between 8 and 18 storeys high swayed in resonance with the waves — the ground and the buildings shaking at the same natural frequency — and many collapsed. The waves were not stronger at the source. The ground they travelled through made them worse.
4.3 What seismic waves taught us about the Earth's interior
Seismic waves are not only the messengers of earthquakes. They are also the only direct probe we have of the deep Earth. By tracking how waves speed up, slow down, bend, and disappear as they pass through the planet, seismologists have mapped the Earth's layers without ever drilling more than a few kilometres down.
Wave type | Motion | Speed (crust) | Travels through | What it revealed |
|---|---|---|---|---|
P wave (primary) | Push-pull, along direction of travel | ~6 km/s | Solids, liquids, gases | Layer boundaries where speed changes sharply |
S wave (secondary) | Side-to-side shear | ~3.5 km/s | Solids only | The outer core is liquid — S waves cannot pass through it |
Love wave (surface) | Horizontal side-to-side | ~3 km/s | Surface layers | Shallow crust structure; strong sideways shaking |
Rayleigh wave (surface) | Rolling, elliptical | ~2.5–3 km/s | Surface layers | Ground rolling that causes most visible damage |
The story this table hides is one of the great detective stories in science. In the early 1900s, seismologists noticed that P waves arriving at distant stations were delayed in a particular pattern, and that S waves vanished entirely beyond a certain distance. The pattern pointed to a boundary about 2,900 kilometres down, below which S waves could not travel. The conclusion — a liquid outer core surrounding a solid inner core — was reached entirely from squiggles on paper. Every model of the Earth's interior, every textbook diagram of the crust, mantle, and core, rests on that reasoning. Earthquakes, the most destructive natural events we know, turned out to be the flashlight that lit up the inside of our own planet.
5. How Scientists Find an Earthquake
An earthquake happens underground, often hundreds of kilometres from the nearest observer, and it is over in seconds. Finding exactly where it happened, and how deep, from nothing but the wiggles it left on distant instruments is one of the quiet triumphs of modern science. The method is nearly a century old, and it still works the same way today.
5.1 The seismograph: an instrument that stays still while the world moves
Earthquakes are recorded by instruments called seismographs, and the recording they make is called a seismogram. The principle is beautifully simple, and the USGS explains it with a clarity that is hard to improve on: a seismograph has a base that is set firmly in the ground, and a heavy weight that hangs free. When an earthquake shakes the ground, the base shakes with it, but the hanging weight, because of its inertia, stays almost still. A spring or string absorbs the movement, and the difference in position between the shaking part and the motionless part is what gets recorded.
The first time I stood in a seismic vault — a small, quiet room built into bedrock, far from roads and railways — I was struck by how still everything was. The vault was designed to be the quietest place imaginable, because a seismometer is an instrument for listening to the whole planet, and the planet whispers. A passing truck, a gust of wind on a nearby tree, even the tide pulling on the coast can show up on a sensitive seismogram. The best stations are buried deep, or placed in abandoned mines, or on the ocean floor. Modern instruments use electronic sensors — the same principles of circuits and electromagnetism behind Fundamentals of Electricity — but the idea has not changed in a hundred years: hold one thing still, and measure how the Earth moves around it.
A single station also records three separate components of motion — north-south, east-west, and up-down — because a wave arriving from below pushes the ground in all three directions, and each direction carries different information. Reading those three traces together is how seismologists tell a P wave from an S wave, and a nearby quake from a distant one.
5.2 Reading a seismogram
A seismogram looks, to the untrained eye, like a scribble. To a seismologist it is a timetable. The trace starts with quiet background noise. Then comes the sharp arrival of the P wave — a small, quick jolt. Then the S wave arrives, bigger and slower. Then the surface waves roll in, the largest and longest part of the record, sometimes shaking for minutes after a great quake.
Two measurements matter most. The time between the P wave and the S wave tells you the distance to the earthquake: the longer the gap, the farther away it was. And the size of the waves — their amplitude — tells you, combined with the distance, how big the earthquake was. That is the whole of earthquake measurement in a sentence: timing gives location, size gives magnitude.
EarthScope, the organisation that operates much of North America's seismic research network, has published a guide to reading seismograms that makes the same point with real records from real stations. The pattern is consistent across every seismogram on Earth: P first, S second, surface waves last, each arriving in its own time, each carrying its own information. Once you learn to read it, a seismogram is less like a scribble and more like a letter from the interior of the planet.
5.3 Triangulation: three circles and an epicenter
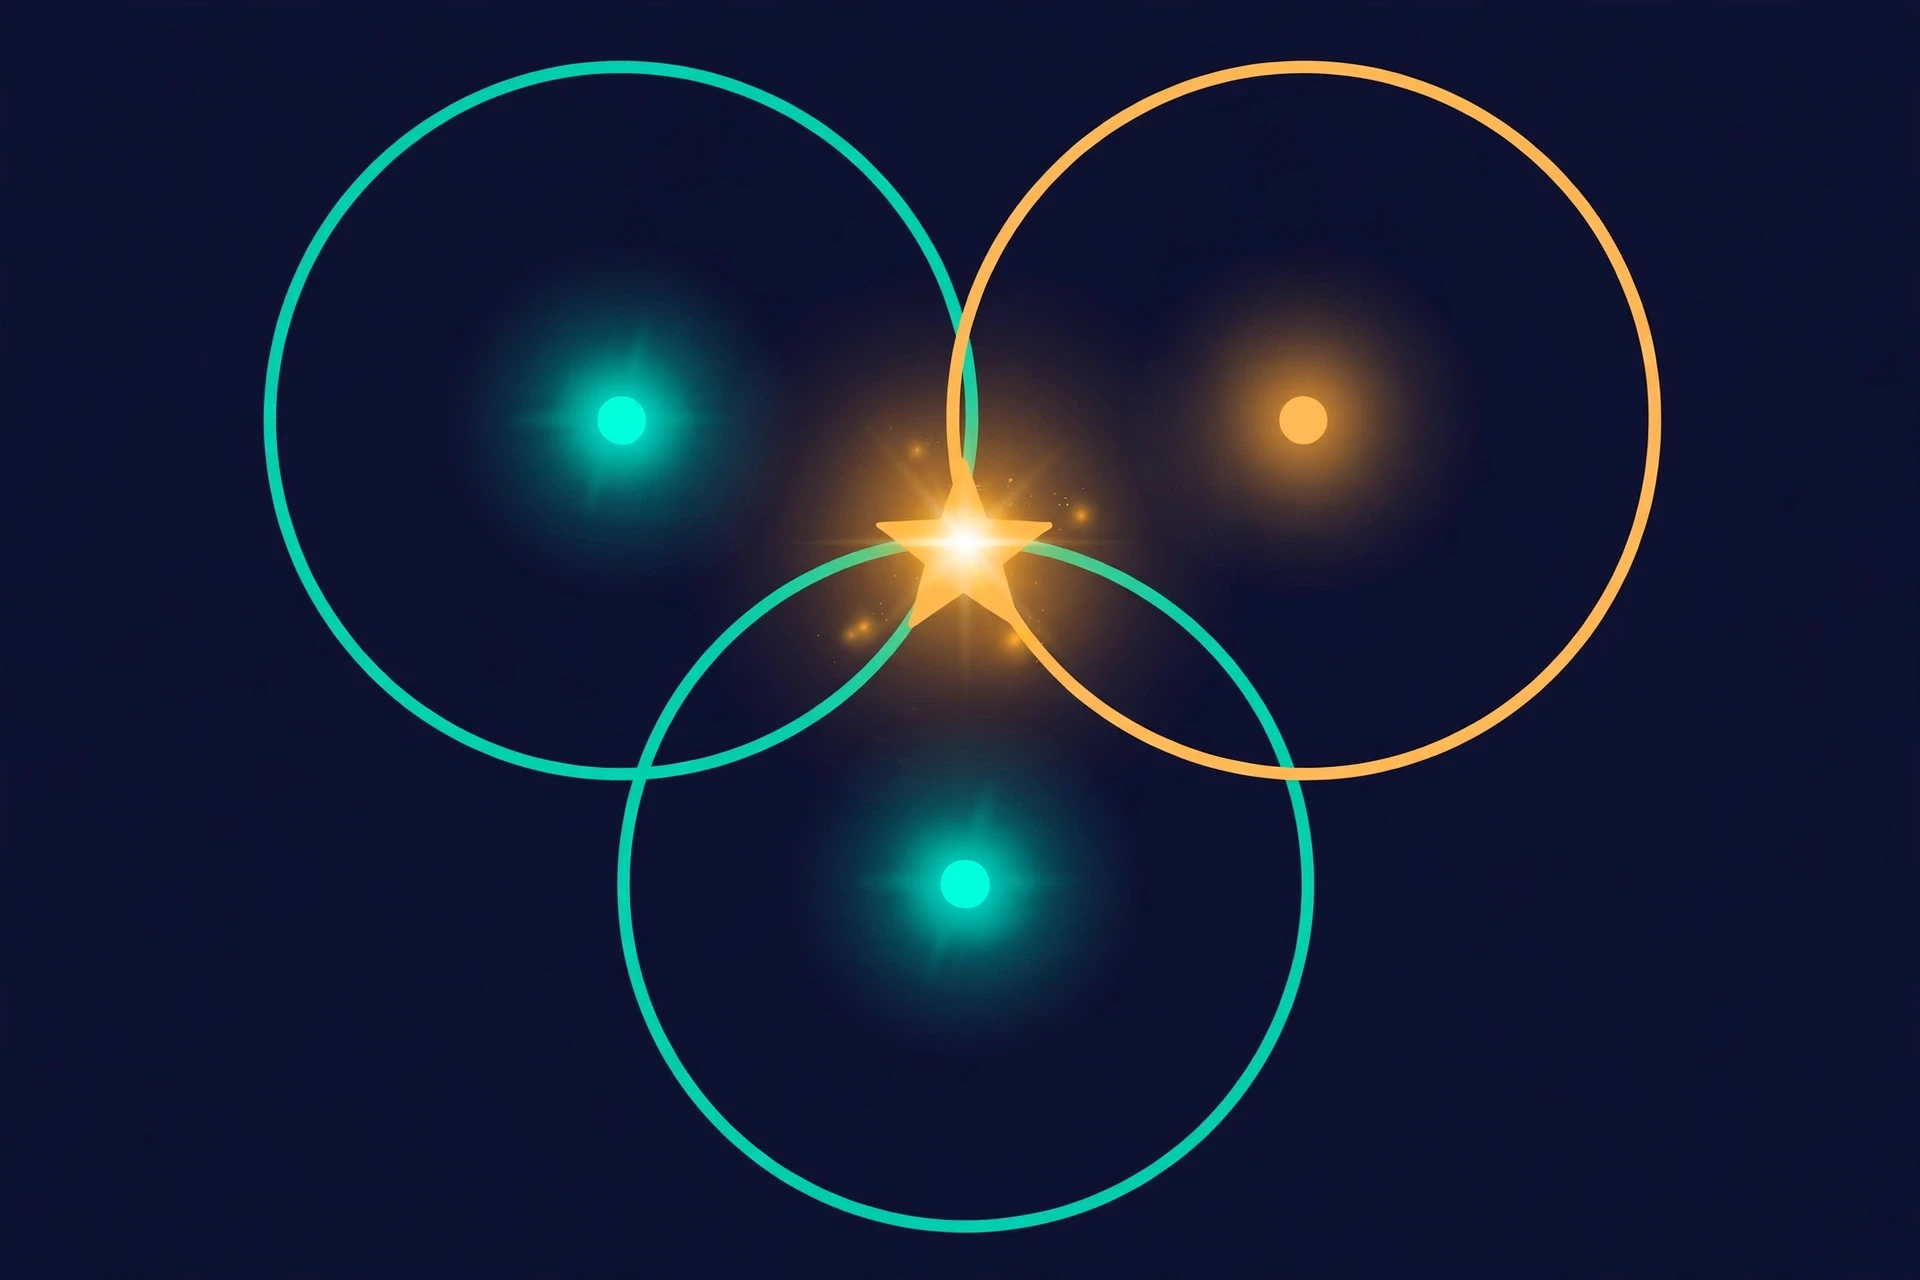
One station can tell you how far away an earthquake was, but not in which direction. The distance defines a circle around the station, and the quake could be anywhere on that circle. Two stations narrow it to two possible points, where their circles cross. Three stations pin it down: the three circles meet at a single point, and that point is the epicenter. The method is called triangulation, and it needs a minimum of three seismograph stations to work.
In practice, modern location uses dozens or hundreds of stations and computer models of how fast waves travel through different kinds of rock. The more stations that record the quake, the more precise the location — and for large quakes, locations are now available within minutes of the event. But the geometry is the same as it was when seismologists drew circles on paper maps with compasses: three distances, three circles, one intersection.
The location of an earthquake is not measured directly. It is inferred — from the arrival times of waves at stations that may be thousands of kilometres apart. That a method this indirect can place a quake to within a few kilometres shows how well we understand the physics of seismic waves.
Depth is harder. It needs stations in different directions and good models of wave speeds, and for deep quakes it can be uncertain by tens of kilometres. But even an approximate depth is valuable: shallow quakes shake harder, deep quakes are felt over a wider area, and the pattern of depths along a subduction zone traces the shape of the diving plate itself, drawing a map of a slab of rock hundreds of kilometres below the surface that no one has ever seen.
6. Measuring Size: Magnitude
When the news reports an earthquake, the first number you hear is almost always the magnitude. It is a single number for each earthquake, and it is meant to describe how big the quake was at its source. But the number most people know — the Richter scale — is not what scientists actually use today, and the difference matters.
6.1 Richter's scale: a brilliant idea with limits
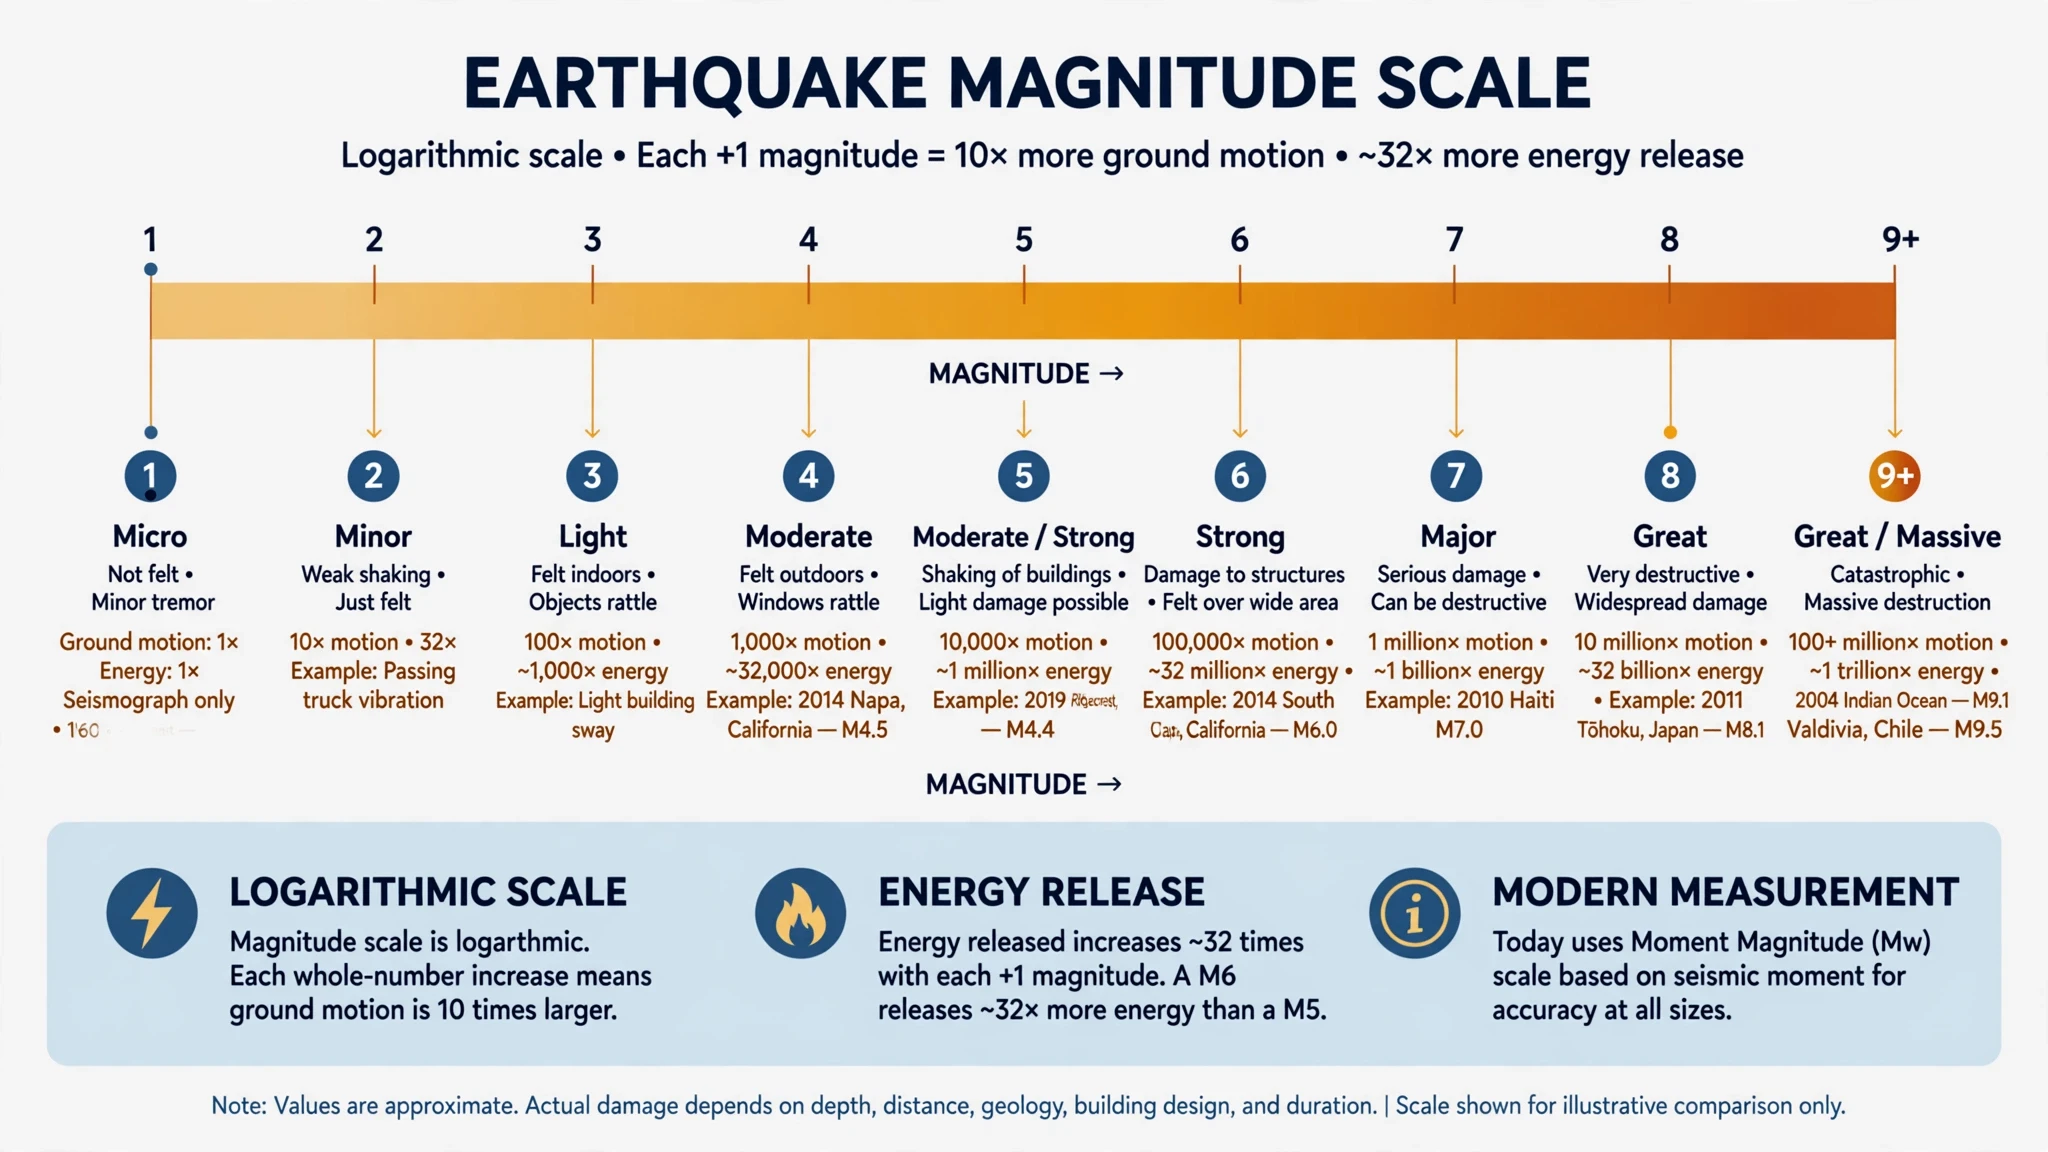
The first widely used magnitude scale was developed in 1935 by Charles Richter at the California Institute of Technology. Richter's idea was simple and elegant: measure the largest amplitude of the waves recorded on a seismogram, correct for the distance from the station, and take the logarithm of the result. The scale was logarithmic, which means each whole-number step represents ten times more ground motion — and roughly 32 times more energy released. A magnitude 6 quake shakes the ground about ten times harder than a magnitude 5, and releases about 32 times more energy. A magnitude 7 releases roughly 1,000 times the energy of a magnitude 5.
The Richter scale, properly called the local magnitude scale, worked beautifully for the earthquakes it was designed for: moderate quakes in southern California, recorded on a specific type of instrument. But it had a flaw. For very large earthquakes, the scale saturated — the wave amplitudes stopped growing in proportion to the size of the quake, so a magnitude 8 and a magnitude 9 could look almost the same on Richter's scale. The scale was like a ruler that only goes up to a certain length: fine for measuring a desk, useless for measuring a road.
6.2 Moment magnitude: the modern standard
The scale seismologists use today is the moment magnitude scale, written Mw, developed by Hiroo Kanamori and Thomas Hanks in the late 1970s. Instead of measuring wave amplitude on one instrument, moment magnitude is calculated from the seismic moment — a physical quantity that combines three things: the rigidity of the rock, the area of the fault that slipped, and how far the ground moved along it. The USGS explains the formula plainly: seismic moment equals rigidity × area × slip, and moment magnitude is derived from that by a standard conversion.
Moment magnitude agrees with Richter's numbers for moderate quakes, which is why the switch was smooth for the public, but it stays accurate for the largest earthquakes on Earth, where the Richter scale fails. It is now the standard for measuring earthquakes worldwide, and when you hear that the 2011 Tohoku earthquake was magnitude 9.1 or the 2004 Sumatra earthquake was magnitude 9.1, those numbers are moment magnitudes. The news may still say "Richter scale" out of habit. The scientists, in almost every case, mean moment magnitude.
6.3 What the numbers mean
The table below gives a sense of what each magnitude band means in practice. The boundaries are approximate — local geology and building quality matter enormously — but the pattern is clear: the scale is logarithmic, so small differences in the number mean enormous differences in energy.
Magnitude (Mw) | Description | Typical effects | How often (worldwide) |
|---|---|---|---|
Below 2.0 | Micro | Not felt; recorded only by instruments | Millions per year |
2.0 – 3.9 | Minor | Often felt; rarely causes damage | Over 100,000 per year |
4.0 – 4.9 | Light | Noticeable shaking; minor damage to weak structures | About 10,000 per year |
5.0 – 5.9 | Moderate | Damage to poorly built structures; felt widely | About 1,500 per year |
6.0 – 6.9 | Strong | Serious damage in populated areas | About 150 per year |
7.0 – 7.9 | Major | Widespread destruction; can trigger tsunamis | About 15 per year |
8.0 and above | Great | Devastation over large regions; tsunamis likely | About 1 per year |
One number in that table deserves a second look: a magnitude 9 earthquake releases about 32,000 times the energy of a magnitude 6. The 1960 Valdivia earthquake, at magnitude 9.5, released more energy than any other earthquake ever recorded — and the ground in Chile moved by metres along a fault more than 1,000 kilometres long. The scale of that is hard to hold in the mind. It helps to remember that magnitude is a measure of energy, not of damage. A magnitude 7 under a desert may kill no one. A magnitude 6 under a city of poorly built concrete can kill tens of thousands. That gap between energy and consequence is the subject of the next section.
7. Measuring Shaking: Intensity
Magnitude is only half the measurement. The other half is intensity: how strongly the ground shook at a particular place, and what that shaking did. Magnitude belongs to the earthquake. Intensity belongs to the location. Confusing the two is the most common mistake in earthquake reporting, and it is worth correcting carefully, because it changes how people understand risk.
7.1 The Modified Mercalli Intensity scale
In the United States, intensity is measured on the Modified Mercalli Intensity (MMI) scale, which runs from I to XII in Roman numerals. Unlike magnitude, intensity is not measured by an instrument. It is based on what people felt and what happened to buildings, objects, and the ground itself. The University of Minnesota's earthquake guide gives the plainest summary of the scale: at intensity I, the shaking is noticed by almost nobody; at intensity VII or above, significant damage to buildings begins; at intensity XII, there is virtually total destruction of all human-made structures.
I–II: Not felt, or felt only by a few people at rest, usually on upper floors.
III–IV: Felt indoors by many; dishes and windows rattle; parked cars rock slightly.
V–VI: Felt by nearly everyone; some dishes and windows break; furniture moves; slight damage to weak plaster.
VII–VIII: Significant damage to poorly built structures; chimneys fall; heavy furniture overturns; well-built buildings suffer slight damage.
IX–X: Severe damage; many buildings destroyed; ground cracks; rails bend; landslides common.
XI–XII: Near-total or total destruction; the ground itself is visibly deformed; objects are thrown into the air.
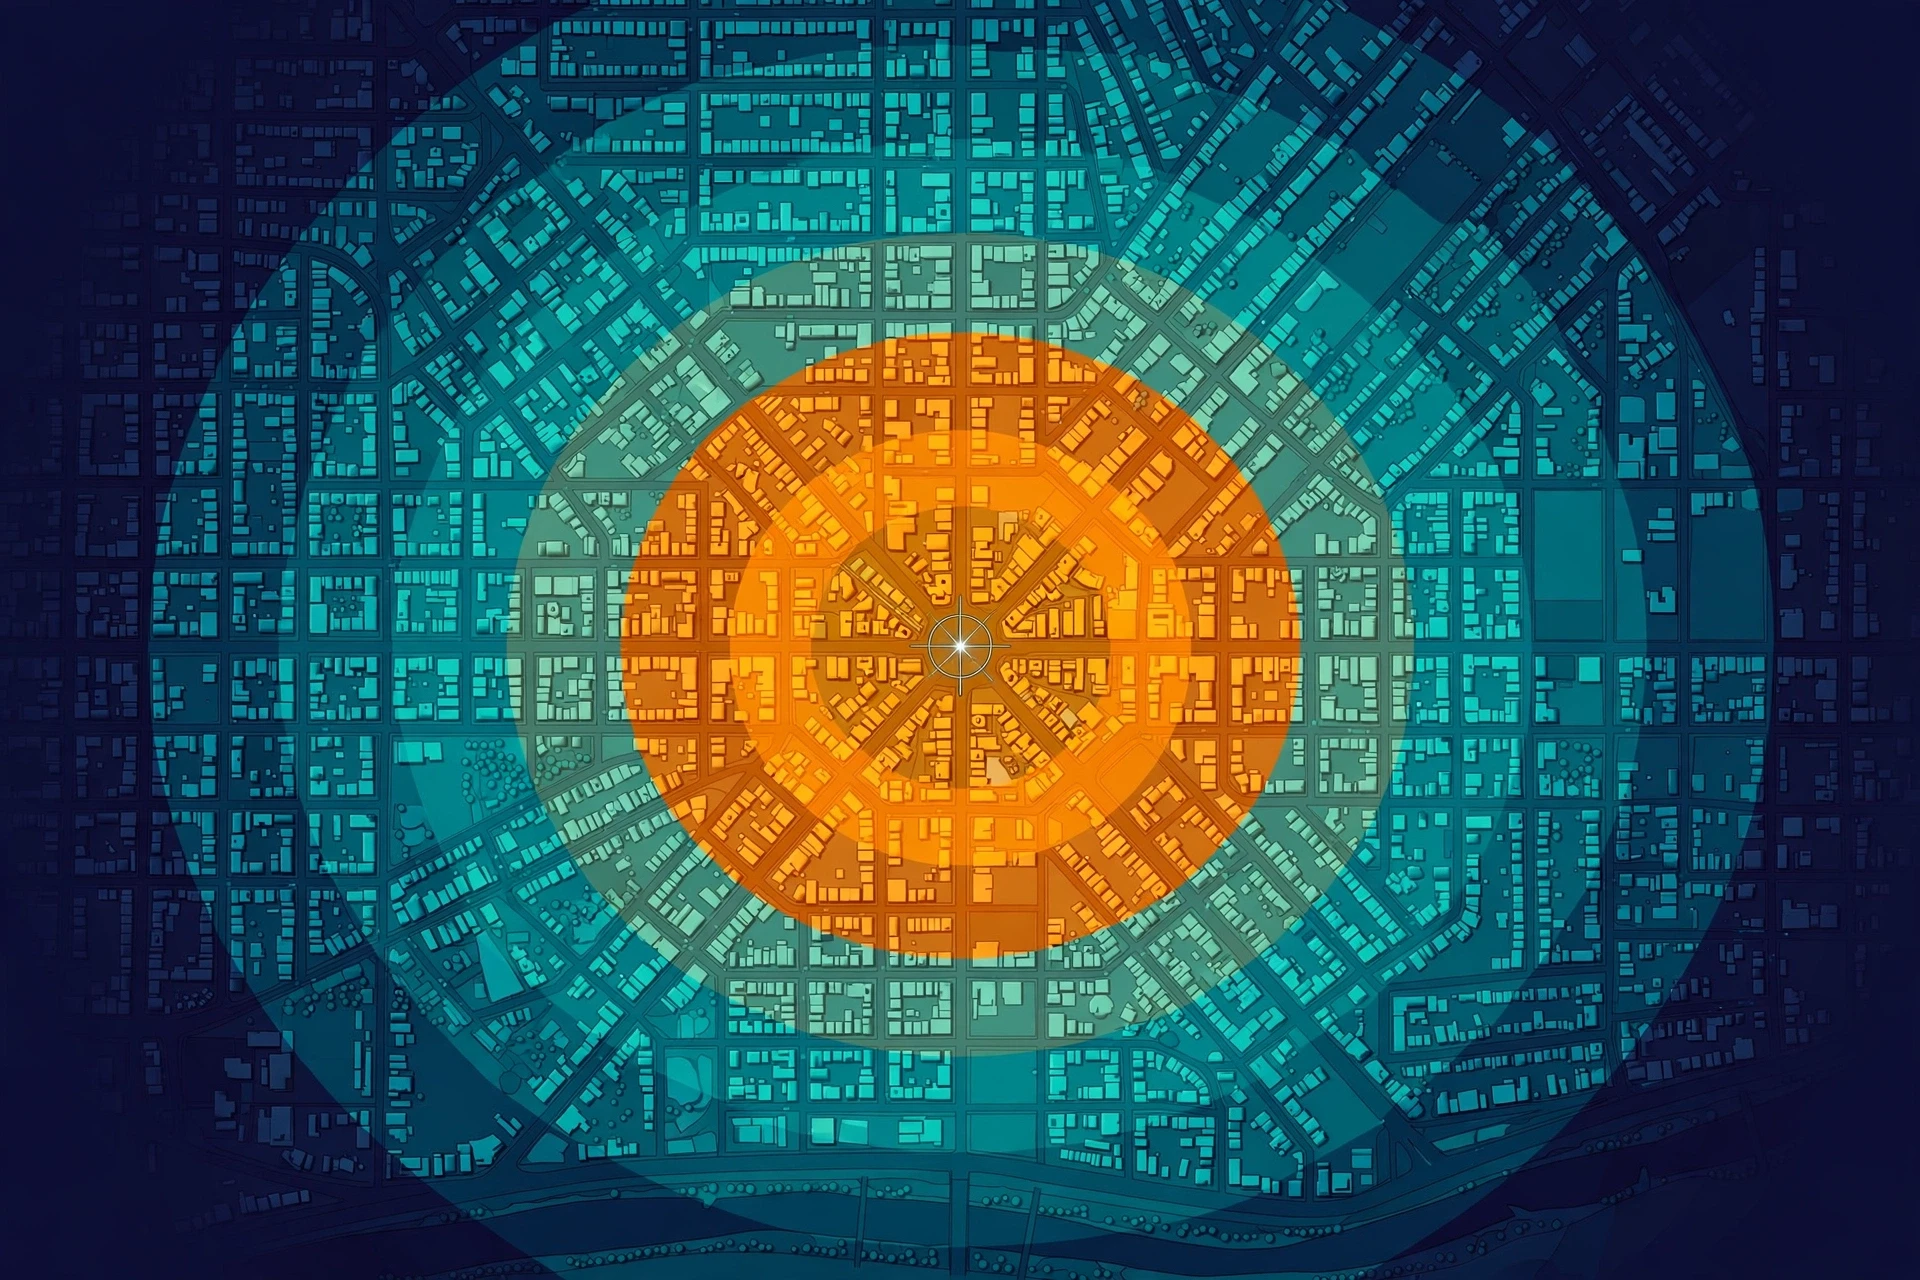
A single earthquake produces a whole range of intensity values: high near the epicenter, fading with distance, and varying with local ground conditions. Seismologists map this as a set of contours, called an isoseismal map, which shows at a glance which neighbourhoods shook hardest. These maps are among the most useful products of earthquake science for engineers and emergency planners, because they show not how big the quake was, but where it hurt.
7.2 Magnitude is not intensity — and why it matters
Here is the misconception I most often have to correct, and I correct it firmly, because it shapes how people judge danger: a big magnitude does not automatically mean big damage where you are, and a moderate magnitude does not mean you are safe. What you experience is intensity, and intensity depends on distance from the epicenter, the depth of the quake, the kind of ground under your feet, and the quality of the buildings around you.
The 2011 Tohoku earthquake was magnitude 9.1, one of the largest ever recorded, and its shaking was felt across Japan. But the greatest loss of life came not from the shaking but from the tsunami it generated. By contrast, the 2010 Haiti earthquake was magnitude 7.0 — large, but not extraordinary — and it killed more than 200,000 people, because it struck directly beneath a densely populated city of poorly built concrete buildings on soft ground. Magnitude measures energy. Intensity measures consequence. When you read about an earthquake, the magnitude tells you how much energy was released; the intensity map tells you what it did to people.
There is a practical point here too. Two houses a kilometre apart can experience very different shaking, because one sits on solid bedrock and the other on soft, water-saturated sediment. The sediment amplifies the waves, sometimes by a factor of several. This is why earthquake hazard maps are drawn not just from fault locations but from soil maps — and why, in a city like San Francisco or Tokyo, the ground beneath a building can matter as much as the fault that threatens it.
8. Where Earthquakes Happen — and Why Some Places Shake Harder
Earthquakes are not spread evenly across the planet. They cluster along plate boundaries, and a few regions account for most of the world's seismic energy. Knowing where they cluster is the first step toward living with them.
8.1 The Ring of Fire
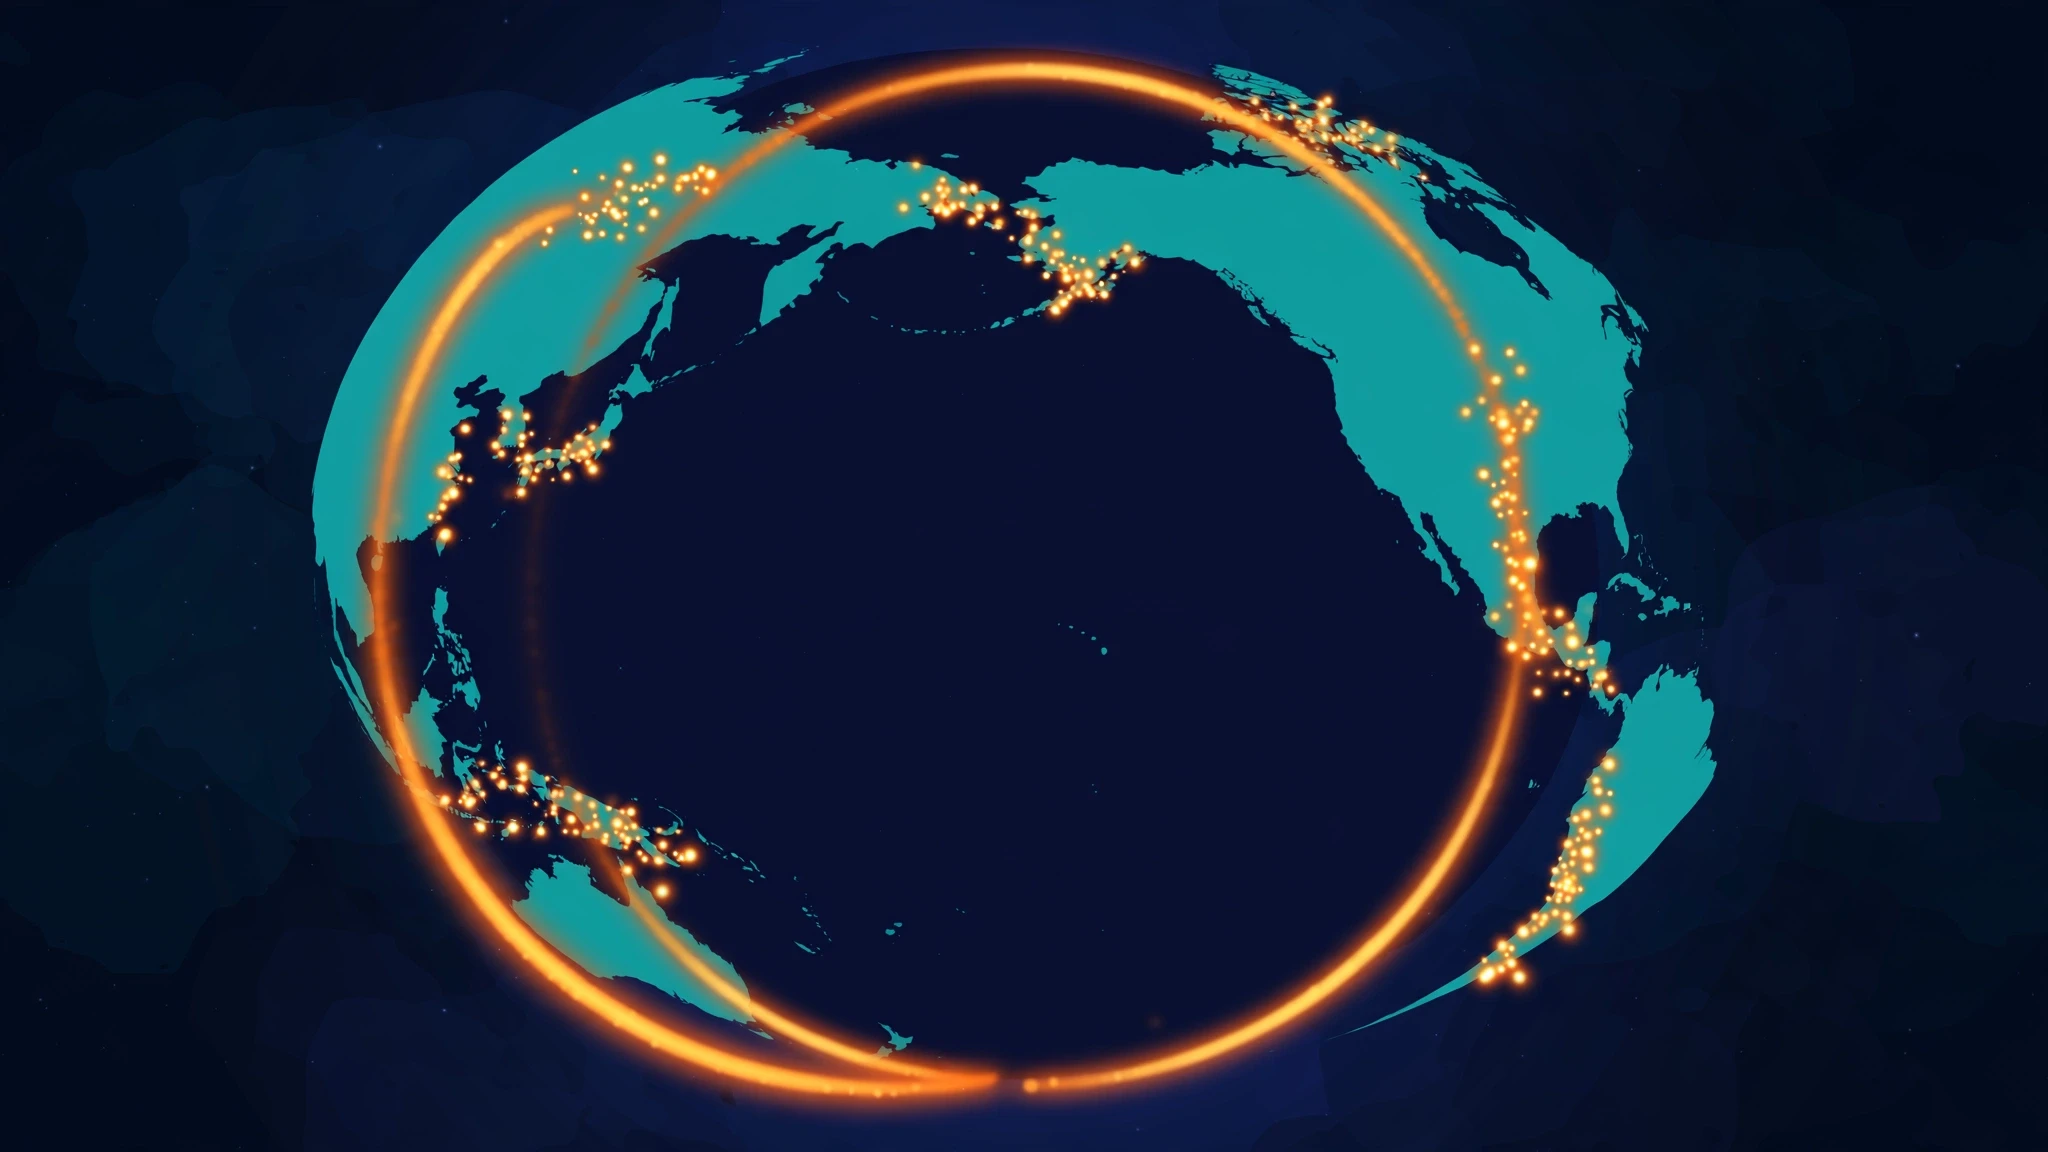
About 80 percent of the world's large earthquakes happen in the circum-Pacific seismic belt, better known as the Ring of Fire — a horseshoe-shaped zone running along the rim of the Pacific Ocean, from New Zealand and Indonesia, up through Japan and Alaska, and down the west coasts of North and South America. It is where many of the planet's subduction zones are: places where oceanic plates dive beneath continents, locking for centuries and then slipping in great quakes. Two other belts are also active: the Alpide belt, running along the southern margin of Eurasia through the Himalayas, Sumatra, and Java; and the Mid-Atlantic Ridge, where the ocean floor is pulling apart.
The map of these belts is also a map of risk. Tokyo, Jakarta, Manila, Lima, Santiago, Los Angeles, and San Francisco all sit on or near them. Roughly half a billion people live in the Ring of Fire's shadow. That is why the countries around the Pacific have, out of necessity, built the world's most advanced earthquake science: Japan's early-warning network, Chile's strict building codes, California's seismic monitoring. The geology chose the places; the people in them had to learn to live with it.
8.2 Depth, soil, and the ground beneath your feet
Two earthquakes of the same magnitude can cause very different damage, and the reasons are physical, not mysterious.
Depth. Shallow quakes, with hypocenters less than about 70 kilometres down, produce the strongest shaking at the surface. Deep quakes, at 300 kilometres or more, spread their energy over a wider area but shake any one place less violently. The deepest earthquakes of all happen in subduction zones, where a diving plate can still be brittle enough to snap at depths of 600 kilometres or more. The 2013 Sea of Okhotsk earthquake, at a depth of over 600 kilometres, was felt across Asia but caused almost no damage.
Soil and sediment. Loose, water-saturated soil can amplify shaking several times over, compared with solid bedrock. Worse, it can liquefy: when strong shaking hits water-saturated sand or silt, the grains lose contact with each other and the ground temporarily behaves like a liquid. Buildings sink, tilt, or topple; underground pipes float upward; sand and water erupt through cracks in the ground. Liquefaction wrecked whole neighbourhoods in the 2011 Christchurch earthquake in New Zealand, where the shaking was moderate but the ground was soft river sediment. The same physics explains why the Water Cycle matters to earthquake science: groundwater, sediment, and the movement of water through the Earth shape how the ground responds when it shakes.
Building quality. The single largest factor in earthquake deaths is not the size of the quake but the strength of the buildings. The same magnitude 7 that kills almost no one in Japan can kill thousands where buildings are made of unreinforced brick and concrete. This is a hard truth, but it is also a hopeful one: it means earthquake deaths are not inevitable. They are, to a large degree, an engineering problem, and engineering problems can be solved.
9. What Earthquakes Can Trigger
An earthquake is rarely the end of the story. The shaking itself lasts seconds to minutes, but the chain of events it sets off can continue for hours, days, and even years.
9.1 Tsunamis: the wave that outruns the warning
When a large earthquake happens under the ocean, and the seafloor lurches upward or downward along the fault, it displaces an enormous volume of water. That displacement becomes a tsunami — a series of waves that travel across the deep ocean at speeds of 700 kilometres per hour or more, about as fast as a jet airliner, and grow taller as they reach shallow water near the coast. In the open ocean, a tsunami may be less than a metre high and pass unnoticed beneath a ship. At the shore, it can arrive as a wall of water tens of metres high.
The 2004 Indian Ocean tsunami, triggered by a magnitude 9.1 earthquake off Sumatra, killed around 230,000 people in fourteen countries. The 2011 Tohoku tsunami, generated by a magnitude 9.1 quake off Japan, reached heights of up to 40 metres in places and caused the Fukushima nuclear disaster. Both events led to major improvements in tsunami warning systems, which now use deep-ocean pressure sensors and seismic data to issue alerts within minutes. The warning system is not perfect — a coastline close to the epicenter may have only minutes before the wave arrives — but it has saved many lives since 2004.
9.2 Landslides, fires, and the long aftermath
Earthquakes trigger landslides on steep slopes, burying roads and villages; the 2008 Wenchuan earthquake in China, magnitude 7.9, triggered tens of thousands of landslides, some of which dammed rivers and created dangerous lakes that had to be drained by engineers. In cities, the shaking breaks gas lines and topples stoves, and the fires that follow can destroy more than the quake itself: the fires after the 1906 San Francisco earthquake burned for three days and destroyed most of the city, and the 1995 Kobe earthquake was followed by fires that raged through wooden neighbourhoods.
The aftermath lasts longer than most people imagine. Aftershocks can continue for years. Damaged buildings must be inspected one by one. Water and power systems take weeks to restore. And the ground itself can keep moving: after a great subduction earthquake, the crust relaxes and creeps for years, a slow afterslip that GPS instruments can measure in millimetres per month. The quake ends in a minute. The Earth takes years to settle.
Ecosystems feel it too. Tsunamis strip coastal forests and flood farmland with salt water; landslides bury streams and change river courses; whole reefs can be lifted out of the water or dropped below it. The recovery of biodiversity after a major quake and tsunami can take decades, and it is one of the least studied parts of earthquake science.
10. Can We Predict Earthquakes?
This is the question every seismologist is asked, and the honest answer has not changed in decades: no, we cannot predict earthquakes — not the time, the place, and the size, together, with the precision that would let people evacuate. The USGS states it plainly, and every serious seismologist agrees: scientists have tried many different ways of predicting earthquakes, and none have been successful. On any particular fault, we know another earthquake will happen sometime in the future, but we have no way of telling when.
10.1 Forecasting is not prediction
There is an important distinction here, and it is one the public rarely hears. Prediction means saying that a specific earthquake of a specific size will happen at a specific place and time. Forecasting means estimating the probability of an earthquake over a longer period — for example, that there is a roughly 70 percent chance of a magnitude 6.7 or larger earthquake in the San Francisco Bay Area in the next 30 years. Forecasts like that are real science, based on the history of past quakes, the rate at which stress is building, and the behaviour of the fault. They are useful for building codes and insurance, but they cannot tell anyone what will happen next Tuesday.
The difference matters because false predictions have real costs. In 2009, six Italian seismologists were convicted of manslaughter after the L'Aquila earthquake, on the grounds that they had failed to warn the public adequately — a verdict that was later overturned, but which sent a chill through the field. The lesson was not that scientists should stay silent. It was that communicating uncertainty is part of the job, and that the public deserves honest statements about what is known and what is not.
10.2 Early warning: seconds that save lives
What we can do — and what has improved enormously in the last twenty years — is early warning. When an earthquake starts, the fast, weak P waves travel outward ahead of the slower, stronger S and surface waves. A network of sensors near the epicenter can detect the P waves, estimate the quake's size and location in seconds, and send an alert to places farther away before the strong shaking arrives. The warning time is short: seconds to, at most, a minute or two. But seconds are enough to stop a train, shut down a gas line, close an elevator door, or get under a desk.
Japan's system, the most advanced in the world, alerts millions of people by phone, television, and radio. Mexico City's system gives residents up to a minute of warning for quakes on the Pacific coast. The United States' ShakeAlert system now covers the West Coast, and it is expanding. I once watched a demonstration in which an alert arrived on a phone in the room eleven seconds before the shaking from a test signal reached us. Eleven seconds sounds like nothing. In an earthquake, it is the difference between being safely under a desk and standing in the middle of a room when the shelves come down.
Early warning has limits. It cannot help the people closest to the epicenter, where the strong shaking arrives almost immediately. And it depends on a dense network of sensors, fast computers, and a public that knows what to do when the phone buzzes. But it is real, it works, and it is getting better every year.
11. Common Misconceptions About Earthquakes — Corrected
Earthquakes attract myths, and some of them are persistent enough to be dangerous. Here are the ones I hear most often, and what the evidence actually says.
"Small earthquakes prevent big ones by releasing pressure." This is the myth I hear most, and it is wrong in a way that matters. It is true that a magnitude 6 releases about 32 times the energy of a magnitude 5. But that also means it takes about 32 magnitude 5 quakes to equal one magnitude 6 — and about 1,000 magnitude 5 quakes to equal one magnitude 7. The small quakes that happen every day release only a tiny fraction of the energy stored along a locked fault. They do not bleed off the stress. The stress stays, and it is released in the big event.
"Earthquake weather — hot, calm, strange skies — means a quake is coming." There is no established link between weather and earthquakes. The USGS notes that if weather affects earthquake occurrence at all, we do not yet understand how it works. Earthquakes happen in all weather, in all seasons, at all hours. The idea persists because people remember the weather on the day of a memorable quake and forget the thousands of identical days when nothing happened.
"Animals can predict earthquakes." There are many anecdotes of animals behaving strangely before a quake, but no controlled study has shown that animals can reliably predict earthquakes, and no mechanism has been established. Animals may react to the small P waves that arrive before the shaking humans feel — a few seconds' warning, not a prediction. That is not nothing, but it is not a forecast.
"The Richter scale is what scientists use today." As Section 6 explains, the Richter scale was designed for southern California in the 1930s and saturates for large quakes. Scientists use the moment magnitude scale for almost all modern reporting. When the news says "Richter," it usually means moment magnitude, reported under the older, more familiar name.
"You should stand in a doorway during an earthquake." This advice dates from a time when doorways in adobe houses were among the strongest parts of the structure. In a modern building, a doorway is no stronger than any other part of the room, and standing in it puts you in the path of a swinging door. The current advice from emergency agencies is simple: drop, cover, and hold on — get under a sturdy table or desk, cover your head and neck, and hold on until the shaking stops.
"California will fall into the ocean." It will not. The San Andreas Fault is a transform boundary: the plates slide past each other sideways, not apart. Los Angeles is slowly moving toward San Francisco, not toward the sea. In about 15 million years the two cities may be neighbours. The ocean will have to wait.
12. The Newest Science: Listening to the Earth in New Ways
Earthquake science is changing fast, and the most exciting developments are not bigger instruments but new ways of listening.
Fibre-optic sensing is turning ordinary telecommunication cables into giant seismometers. A technique called distributed acoustic sensing sends laser pulses down a fibre-optic cable and measures tiny changes in the light that bounces back. Every few metres of cable becomes a sensor, so a single cable under a city or along the ocean floor can record thousands of points of ground motion at once. Researchers have used existing cables to record earthquakes, ocean waves, and even traffic — without installing a single new instrument.
Machine learning is transforming how seismograms are read. Neural networks trained on millions of earthquake records can now pick out P and S wave arrivals, locate small quakes, and separate real events from noise faster and more consistently than a human analyst. This matters because the number of recorded quakes is exploding: dense networks and fibre sensing produce far more data than people can read by hand. The machines do not replace seismologists. They do the first pass, and the humans do the thinking.
Slow slip and silent earthquakes are rewriting what we thought we knew about faults. In the last twenty years, GPS instruments have revealed that some faults move slowly, over days or weeks, without shaking at all — releasing energy equivalent to a magnitude 6 or 7 earthquake so gradually that nobody feels it. These slow-slip events happen in subduction zones around the world, and they appear to load and unload the locked parts of the fault. Understanding them may be the key to understanding why some faults produce great quakes and others creep quietly.
The 2025 Myanmar earthquake showed why all of this matters. On 28 March 2025, a magnitude 7.7 earthquake struck central Myanmar, rupturing the Sagaing Fault — a transform fault much like the San Andreas — and killing thousands. Within hours, seismologists around the world had located the quake, estimated its magnitude, and modelled the fault rupture from satellite data. The speed of that response would have been impossible twenty years ago. The science is working. The challenge now is making sure the knowledge reaches the people who live on the faults, in buildings that can survive what the science predicts.
The Earth will keep moving. The question is not whether the next great earthquake will happen, but whether we will be ready for it — with buildings that stand, warnings that arrive in time, and a public that understands what the ground is telling them.
Conclusion
An earthquake is a simple event with enormous consequences: rock slips, energy radiates, the ground shakes. But behind that simplicity is one of the richest stories in science. The same forces that cause earthquakes built the continents, raised the mountains, and opened the ocean basins. The same waves that destroy cities have revealed the liquid core of the planet, mapped the boundaries of tectonic plates, and let us listen to the Earth ringing like a bell after a great quake.
We cannot predict earthquakes, and we should be honest about that. But we can measure them, locate them within minutes, warn people seconds before the shaking arrives, and build cities that survive them. The science has moved from drawing circles on paper maps to fibre-optic cables that listen to the ground under entire cities, and from Richter's hand-cranked scale to computer models of fault rupture in real time.
The next time you feel the ground move — even a small tremor, a rattle of dishes, a sway you are not quite sure you felt — remember what it is. It is the planet adjusting itself, a few centimetres at a time, after centuries of slow strain. It is a reminder that the ground under our feet is not fixed. It is alive with motion, and we are lucky enough to live at a moment in history when we can measure that motion, understand it, and, more and more, prepare for it.
The Earth is speaking. We have finally learned how to listen.
Frequently Asked Questions
What causes an earthquake?
An earthquake is caused by the sudden slip of rock along a fault, usually when stress built up by moving tectonic plates overcomes the friction holding the fault locked. The stored energy is released as seismic waves that shake the ground. Most large earthquakes happen at plate boundaries, but some are caused by volcanic activity, human activity such as wastewater injection, or the collapse of underground cavities.
How do earthquakes happen?
Earthquakes happen in stages: tectonic plates move a few centimetres a year, their edges lock together by friction, stress builds up over decades or centuries, and then the locked fault ruptures. The rocks on either side snap back in a process called elastic rebound, releasing stored energy as seismic waves. The rupture can run along hundreds of kilometres of fault in under a minute.
What is the difference between the hypocenter and the epicenter?
The hypocenter, also called the focus, is the point underground where the earthquake rupture begins. The epicenter is the point on the Earth's surface directly above the hypocenter. The hypocenter can be a few kilometres or several hundred kilometres deep, while the epicenter is the location shown on maps and used to describe where the quake was centred.
What are P waves and S waves?
P waves (primary waves) are the fastest seismic waves; they squeeze and stretch rock in the direction of travel and can pass through solids, liquids, and gases. S waves (secondary waves) are slower and shear rock from side to side; they can only travel through solids. The time gap between their arrivals at a seismograph tells scientists how far away the earthquake was. The fact that S waves cannot pass through liquid proved the Earth's outer core is molten.
How are earthquakes measured?
Earthquakes are measured in two ways: magnitude, which describes the energy released at the source, and intensity, which describes how strongly the ground shook at a particular place. Magnitude is measured on the moment magnitude scale (Mw) from seismogram recordings. Intensity is measured on the Modified Mercalli Intensity scale (I–XII), based on observed effects on people, buildings, and the ground.
What is the difference between the Richter scale and the moment magnitude scale?
The Richter scale, developed in 1935, measures wave amplitude on a specific type of seismograph and was designed for southern California. It saturates for very large earthquakes. The moment magnitude scale, developed in the 1970s, is calculated from the physical size of the fault rupture — rock rigidity, fault area, and slip — and stays accurate for earthquakes of all sizes. It is the standard scientists use today, though news reports often still say "Richter" out of habit.
Can scientists predict earthquakes?
No. Scientists cannot predict the time, place, and size of a specific earthquake. They can forecast probabilities over decades — for example, the chance of a large quake on a given fault in the next 30 years — and they can issue early warnings seconds before strong shaking arrives, using the gap between fast P waves and slower, stronger waves. But short-term prediction of individual earthquakes has never been achieved despite decades of research.
What is the largest earthquake ever recorded?
The largest earthquake ever recorded was the magnitude 9.5 Valdivia earthquake in Chile on 22 May 1960. It ruptured a fault more than 1,000 kilometres long, generated a tsunami that crossed the Pacific, and caused widespread destruction in southern Chile. The 2004 Sumatra earthquake (magnitude 9.1) and the 2011 Tohoku earthquake in Japan (magnitude 9.1) are the next largest in the modern instrumental record.
Why do some earthquakes cause tsunamis and others do not?
Tsunamis are caused by large earthquakes under the ocean that move the seafloor vertically, displacing a huge volume of water. Shallow, large-magnitude quakes on subduction zones are the most dangerous, because they can lift or drop the seafloor by metres over a wide area. Deep earthquakes, smaller earthquakes, and quakes where the fault slips sideways rather than vertically displace little water and are unlikely to generate a significant tsunami.
How can I stay safe during an earthquake?
Drop, cover, and hold on: get under a sturdy table or desk, cover your head and neck, and hold on until the shaking stops. Stay indoors until the shaking ends, then move outside carefully, watching for falling debris and aftershocks. Avoid doorways, windows, and heavy objects that could fall. If you are near the coast and feel strong shaking, move to high ground immediately — a tsunami can arrive within minutes. Keep an emergency kit with water, food, and a first-aid kit, and know your local evacuation routes.
Sources / Further Reading
USGS — The Science of Earthquakes: https://www.usgs.gov/programs/earthquake-hazards/science-earthquakes
Caltech Science Exchange — What Causes an Earthquake, and What Happens During a Quake?: https://scienceexchange.caltech.edu/topics/earthquakes/what-causes-earthquakes
USGS — Earthquake Magnitude, Energy Release, and Shaking Intensity: https://www.usgs.gov/programs/earthquake-hazards/earthquake-magnitude-energy-release-and-shaking-intensity
University of Minnesota — Earthquakes: https://cse.umn.edu/mgs/earthquakes
USGS — Earthquakes (General Interest Publication): https://pubs.usgs.gov/gip/earthq1/how.html
EarthScope / IRIS — Seismic Signatures: How to Read a Seismogram: https://ngf.earthscope.org/hq/inclass/downloads/optional/832